
Have you noticed that strategy professionals do not know finance very well and finance professionals do not know competitive strategy very well? Or maybe they do and just do not choose to elaborate in each other’s domains. But let me say at the outset that I think a sub-field of an intersected competitive strategy and finance is emerging.
To emphasize: My observation is that competitive strategy professionals and academics typically do not know much about firm value creation principles and finance professionals and academics do not typically know much about competitive strategy. I know there are outliers in each group, but am I correct in saying this? Am I also being unkind in my assessment? If I am correct though, is this situation caused by each set of professionals and academics ceding the ground to the other group thinking “they will cover their areas of expertise” so we don’t need to do so? And as such they don’t need to add pages to their viewpoints and writings? Or is there an honest deficiency of knowledge in each area of the other that makes this problematic?

Whatever the reality, I think the time is ripe to forge direct linkages between the two areas of expertise and research. I also think both fields can be strengthened thereby and this bonding can aid practitioners greatly. This article will offer a summary of my attempts over the last thirty-six years to try to intersect competitive strategy and value creation principles. This blog type article is not meant to be definitive. Its purpose is to start a conversation. And some of the exhibits below are idiosyncratic to me, although they have some academic underpinning.
You might ask where my authority comes to write on this subject. During my doctoral years many years ago I finished all my course work for a doctorate in finance. But I developed a passion for competitive strategy and that area became my major area and finance my minor area of study. I subsequently spent twenty-five years in the field as a consultant trying to apply this learning for clients.
As such this two-part article will:
- Provide a caveat to set the context for the article.
- Provide five examples of how competitive strategy (hereafter CS) and shareholder value (SHV) can be linked from very simple to more complex.
- Suggest how these linkages can strengthen practice.
- Offer ideas for future research and practice.
1. Caveat: Why People Wake Up and Go to Work
Recently many writers have stated that people do not wake up in the morning to go to work to “make shareholder value” (SHV). They go to work to make and deliver the products and services they signed up for and enjoy making and delivering these. These statements are 100% correct in my view, but my view is also that employee engagement and satisfaction, supplier satisfaction, and leadership satisfaction are lead aspects that eventually produce SHV. These are two sides of the same coin in my view. A competitive strategy must eventually provide free cash flow return on investment that is greater than the firm’s weighted average cost of capital regardless of how the financial value created is apportioned for employees, suppliers or whichever other stakeholder we care to serve. I know this claim is still hotly contested now. We need to shelve this discussion to other articles given the purpose of this article.
2. Examples of how competitive strategy and value creation principles (hereafter VCP) can be linked from very simple to more complex.
Part 1 of this article will depict three of five examples of how we could link CS and SHV. The three examples in Part 1 are fairly simple and straightforward. Part 2 will discuss the fourth and fifth examples, which are more comprehensive and complex. I have used all of these before in various client settings and academic research projects. Also there are scores of other frameworks that could be used here. Remember this article is not a definitive treatment of this subject, only an opening salvo. And another point: these frameworks happen at the business unit level of CS, not the corporate level.
First of all, let’s set some ground with Figure 1. I have presented this chart in four or five other articles here so the reader might be familiar with it. It depicts the classic purely financial drivers of SHV for publicly traded firms or what I call Owner Wealth for private for-profit firms:
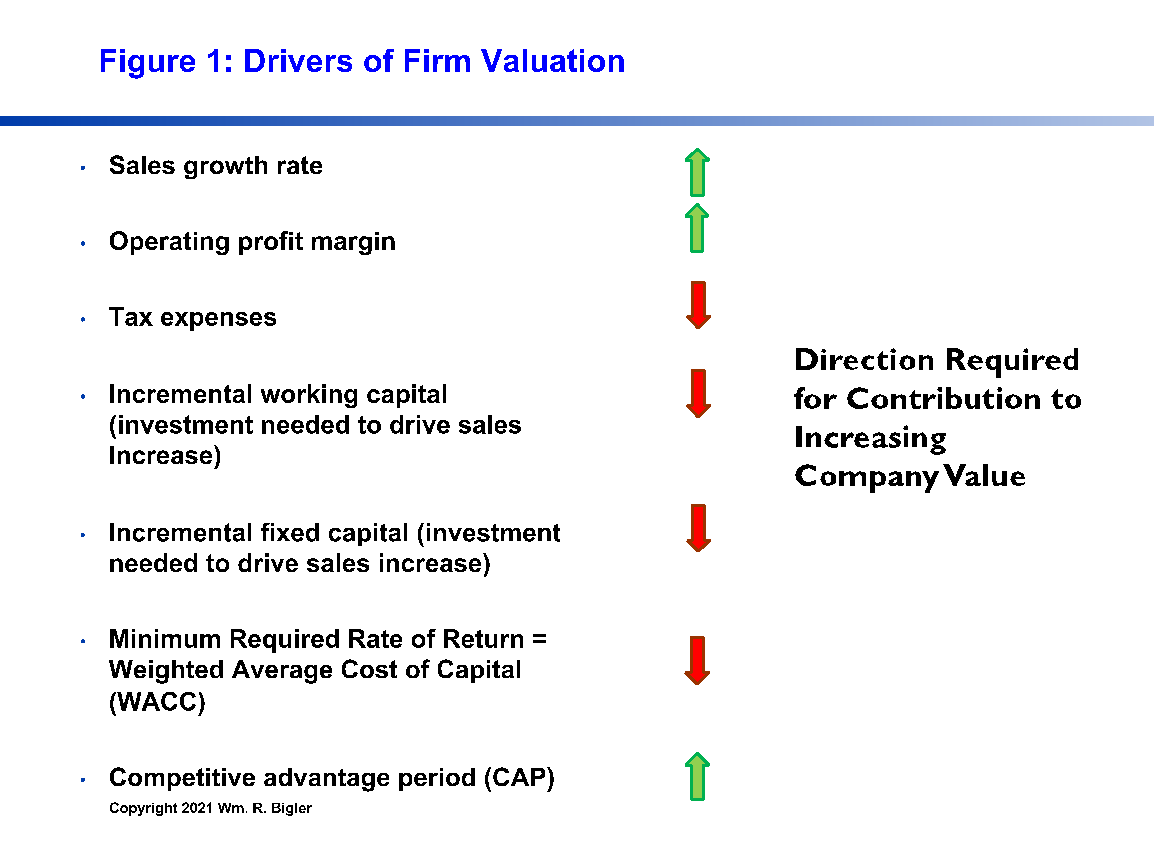
One can see the direction required for each Driver to contribute to creating and growing SHV. Competitive Advantage Period (CAP) might be new to some readers so here is a link to an article I wrote on this last year (See Where Strategy and Finance Intersect). It is basically the length of time into the future the firm expects to maintain some form of competitive advantage that will protect free cash flow return on investment to some degree.
The reader will notice that all of the five examples suggest how a particular framework of CS impacts groups of the seven financial Drivers from Figure 1. These measures are improved through the mechanism of the firm’s competitive strategy (CS) reducing what financial professionals call Fade. Fade is a law of finance that says absent some form of innovation, a firm’s free cash flow return on investment (FCFROI) will fade or degrade over time to the long run average return across all industries. This FCFROI number is around 6%, and as fade increases, CAP decreases.
Example 1: Creating and Capturing Value

As one can see from the citations in Figure 2, this notion has been around at least since 1998. I published an article here in 2018 using this figure (See Extracting versus Creating Value). Dr. Felix Oberholzer-Gee has published a great new book on this titled Better, Simpler Strategy: A Value-Based Guide to Exceptional Performance (2021). He describes this chart vertically and labels it the Value Stick, but the learning is the same in my view.
Briefly the key takeaways from the chart are:
The value a firm creates in a transaction with customers is the difference between Customer Willingness to Pay (CWTP) and Supplier Willingness to Supply (SWTS). CWTP is the most a customer would pay for our product or service. SWTS is the least a supplier to our firm would take for their inputs. This is their price for their product or service to our firm and is our cost. Notice it is our firm that creates this value.
We typically do not know the exact CWTP and SWTS price points. Customer and suppliers do not want us to know. How our firm approximates these price points is done through negotiation or observations over many cycles of buying. This is why what we end up charging the customer is almost always lower than their CWTP prices point. And this is why we almost always “allow” suppliers to charge us more than their SWTP price point. Many times the prices in red in Figure 2 are also due to our firm desiring to share some of the value we create by giving suppliers more margin and allowing customers to pay less than their CWTP price point. Thus of the total value our firm creates, the reader can see the Customer’s share and Supplier’s share of the value created. Felix’s book goes into great detail using many examples of this Value Stick and is a very valuable read in my view.
Here is how this depiction from competitive strategy helps to drive increases in SHV. As Dr. Oberholzer-Gee tells us, firms should focus first on increasing Value as measured by the difference in CWTP and SWTP. Our firm increases value by increasing CWTP and lowering SWTS. Firms that do this have the greater chance to then capture an appropriate share of that value created and reap financial performance rewards via some or all of the Drivers in Figure 1.
At the end of the day, increasing CWTP helps to increase our prices and decreasing SWTP helps to lower our costs, while providing for customers and suppliers to share some of the value created by our firm. And if done by providing some protection from deterioration of prices falling and cost increasing into the future, fade is negated and CAP is increased as well. Finally if this protection helps to lower the variability of free cash flow into the future, the firm’s WACC can decrease as well. All of these help improve the financial Drivers from Figure 1.
Example 2: Dr. Porter’s Value Chain Intersected With the Elements of Free Cash Flow

For readers not familiar with the non-green part of Figure 3, this is the classic Value Chain presented by Dr. Michael Porter in 1985 in his landmark book Competitive Advantage. It depicts the flow of how customer and financial value are created from left to right. Inbound Logistics to Service are called Primary Activities. Firm Infrastructure, Human Resource Technology, Technology Development and Procurement are called Support Activities. In the green part of the chart I simply add the elements of Cash Flow, which are also most of the financial Drivers from Figure 1. The fifth row suggests examples of a firm’s Expenses, the sixth row some examples of Working Capital Investment and the last row some examples of Fixed Capital Investment. The items in Red simply highlight Activities with example Expenses, Working Capital and Fixed capital numbers that might be more important over others.
This is the key idea here: different Activities and their “numbers” will be more or less important depending on whether the firm chooses to compete as a Low-Cost Provider, or Differentiator or the rare but possible dual method of competition. The dual method enjoys higher prices and lower costs at the same time.
The green portion of Figure 3 is very simple. Revenue equals Price times Quantity Sold. And the reader can see the other elements of cash flow: expenses, incremental working capital and incremental fixed capital investment. With the subtractions from Revenue, we end up with Cash Flow From Operations. For Free Cash Flow From Operations, the number we are really striving for, we need to subtract a “capital charge” from cash flow to arrive at Free Cash Flow. The capital charge is the firm’s Weighted Average Cost of Capital (WACC) times its invested capital.
Choosing and implementing various key Activities of the Low-Cost Provider, the Differentiator or the Dual method of competition drives either Revenue or lowers Expenses and Working capital and Fixed capital investment. These conform to the dictates of the Drivers of Financial Value from Figure 1 to increase SHV.
This is a static picture of linking CS to SHV and is at a fairly high level of generalization. The next example introduces a dynamic or time component to the mix.
Example 3: The 4Bs Approach
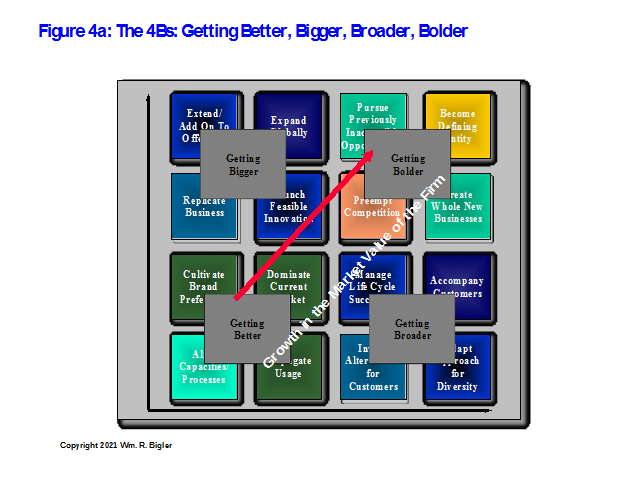
Here is where we start getting more idiosyncratic to me. But being an intermittent professor of strategy, all of my work has, or tries to have, academic underpinnings. I was on a team in 1994 that first developed this chart while I was in the consulting unit of EDS. Originally it was developed for a speech the Chairperson of EDS was to deliver in Tokyo in 1994. The chart caught on in popularity and I have improved it ever since. The 4Bs chart begins to suggest that competitive strategy (CS) and SHV should be viewed dynamically. That is both CS and SHV change as time moves forward and indeed that time and speed (or lack thereof) are critical new variables in creating sustainable competitive advantages and SHV.
The key takeaway is any firm has a baseline situation in any current time period and can be located somewhere on the 4Bs grid. To provide for sustainable competitive advantage and increases in SHV, any firm needs to move on a journey from the lower-left quadrant (say Getting Better) to Getting Bolder, always through Getting Bigger and Getting Broader. Note that this journey can take ten to fifteen years or longer. While we would like for this journey to take much less time, experimentation, innovation and learning must and do ensue. Mistakes will be made that will cause setbacks. But if the firm moves on its journey as fast as possible while respecting the seven Financial Drivers from Figure 1, SHV should increase.
The mechanism that translates movement on the 4Bs grid is the identification and removal of barriers. This identification and removal increases the speed of a company’s processes and increases the “cycles of learning” in a given year. It is from these cycles of learning that increases in SHV can happen.
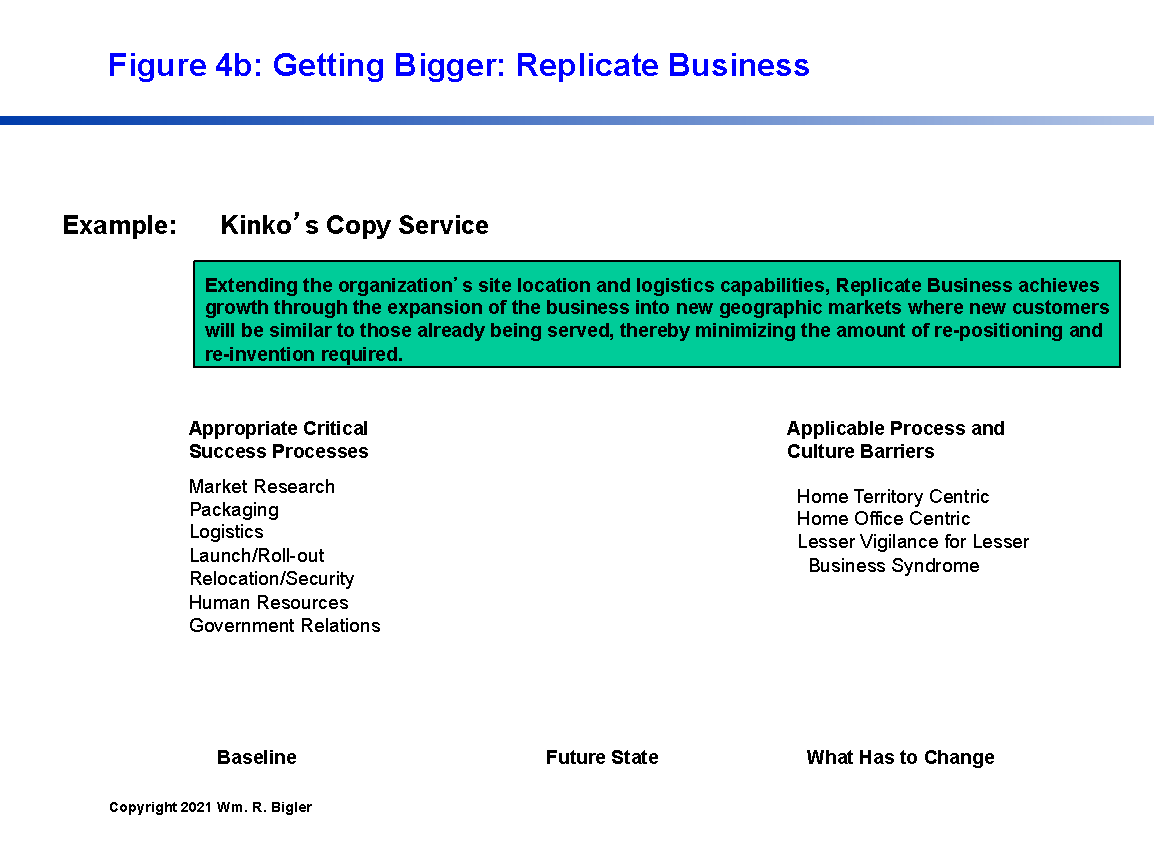
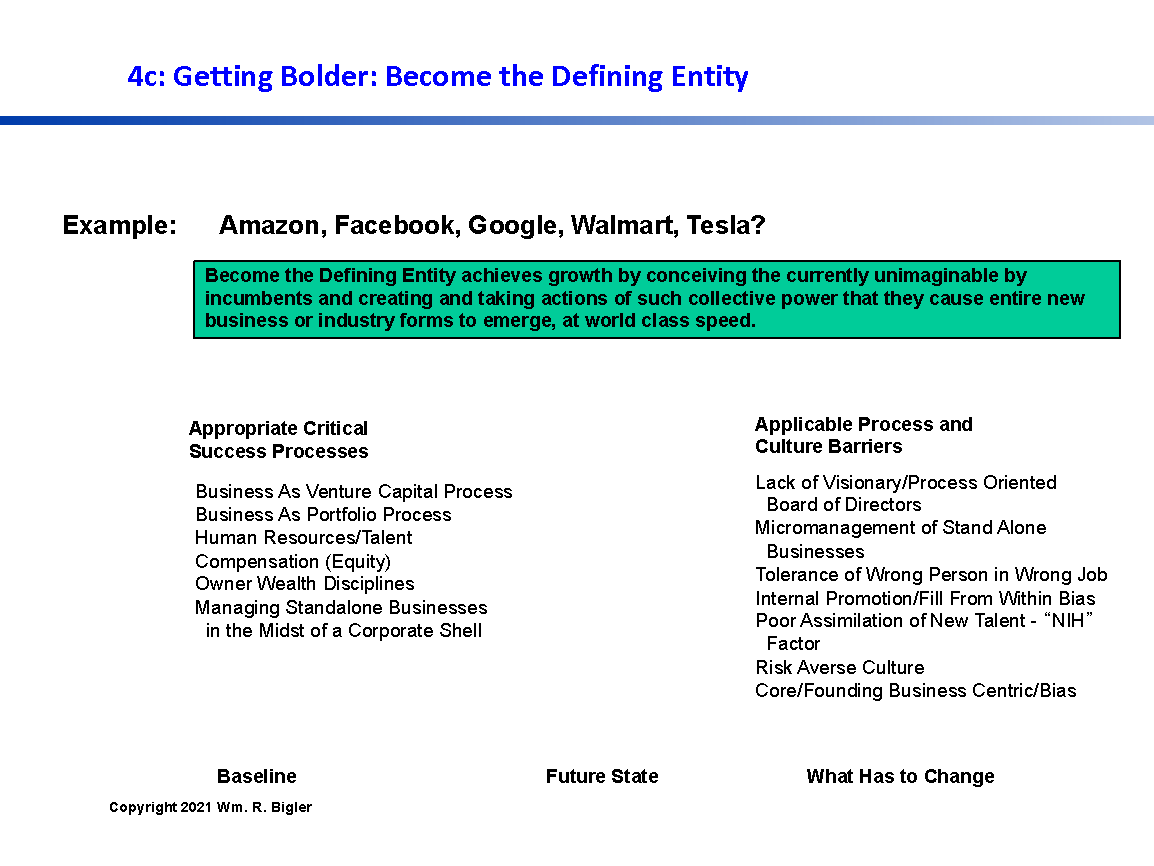
By way of elaboration, Figures 4B and 4c show how two of the sixteen cells can be fleshed out for diagnosis and improvement. The charts depict a firm’s Baseline Situation, a placeholder for a derivation of a desired Future State, and what kind of processes is best used. Finally, typical Barriers are listed.
Part 2 of this article will pick up with the last two examples of linking CS and SHV and offer ideas for improving research and practice in the emerging sub-field of competitive strategy and SHV.
References
- David Holland and Bryant Matthews, Beyond Earnings: Applying the Holt CFROI and Economic Profit Framework, Wiley, 2018, 383 pages.
- Bartley J. Madden, Value Creation Principles, Wiley, 2020, 250 pages.
- Bartley J. Madden, Maximizing Shareholder Value and The Greater Good, LearningWhatWorks, 2005, 54 pages.
- Greg V. Milano, Curing Corporate Short-Termism: Future Growth vs. Current Earnings, Fortuna Advisors, 2020, 351 pages.
- Felix Oberholzer-Gee, Better, Simpler Strategy: A Value-Based Guide to Exceptional Performance, Harvard Business Review Press, 2021, 288 pages.
- Alfred Rappaport, Creating Shareholder Value: The New Standard for Business Performance, Free Press, 1986, 270 pages. Revised edition 1998, Free Press, 205 pages.
- Michael Porter, Competitive Advantage: Creating and Sustaining Superior Performance, Free Press, 1985, 557 pages.
- Bennett Stewart, The Quest for Value, Harper Business, 1991, 800 pages
This article is part of a series on what causes a firm’s value to increase.
Dr. William Bigler is the founder and CEO of Bill Bigler Associates, an independent strategy and financial value and wealth research endeavor. He is a former Associate Professor of Strategy and the former MBA Program Director at Louisiana State University at Shreveport. He was the President of the Board of the Association for Strategic Planning in 2012 and served on the Board of Advisors for Nitro Security Inc. from 2003-2005. He is the author of the 2004 book “The New Science of Strategy Execution: How Established Firms Become Fast, Sleek Wealth Creators”. He has worked in the strategy departments of PricewaterhouseCoopers, the Hay Group, Ernst & Young and the Thomas Group among several others. He can be reached at bill@billbigler.com or www.billbigler.com.