
The strategic management of for-profit firms seeks, among other things, to secure the most advantaged future as is possible in today’s VUCA business world. VUCA, of course, stands for Volatile, Uncertain, Complex and Ambiguous.
Many writings in this area are at the bird’s eye view of a 30,000-foot level. Some of my writings have been written at this level of generalization. But this level of generalization could be at the “quick fixes” level and in my view should be avoided. Some of the writings also get close to being in the trees or even in the weeds. Some of my writings have been like this as well. While these kinds of writings and views are not normally of the quick-fix variety, they can be seemingly trivial in nature, really covering myriad tactics and not strategy. There is nothing inherently wrong with either of these two extremes as long as the author states his/her objective of the article, blog or book and uses the appropriate level of generalization to provide something useful for practice.

I think we need writings that meld the two extremes in dynamic interplay. Thus the purpose of this article is to show how practitioners can zoom from one level of generalization for strategic management to another and then go back again as needed. The touchstone for this exercise is how to describe how each of the people in your firm contributes to the strategic management of the firm. It gets hard to go directly from a 30,000-foot view to seeing how each of your people contributes, so I will offer an approach to do this – a revised look at the classic Position Description. As with some of my other articles, here I will try to be short on verbiage as I build a series of pictures and exhibits that describe this challenge of engaging every one of your people in the strategic management of your firm while having a firm secure its future.
One point before we proceed. As with all of my writings, I write to be agnostic to any one tool or framework. So you can “plug and play” any and all tools and frameworks you like and use.
The Brushstrokes for Strategic Management
Figure 1 (below) portrays my view of the major Elements for strategic management at a 30,000-foot view. This painting metaphor portrays the “minimum necessary and sufficient” Elements that need to be blended usefully for an overall solution depending on the nature of the external environment(s) in which a firm competes. To give credit, this presentation style is adapted from a very good book from 1997 titled The Shape Shifters: Continuous Change for Competitive Advantage by John Mariotti.

The Elements in the rectangles are desired End States. The Elements in the Ovals are some of the key Enablers for the End States. The middle larger circle is a key desired Outcome from these aligned solutions – Competitive Advantage Period (CAP). CAP was first introduced, to my knowledge, by Al Rappaport in his landmark book Creating Shareholder Value: The New Benchmark for Corporate Performance, (1986, 1998 rev) where he called it Duration. CAP is the length of time into the future a firm can expect any competitive advantage to last. A CAP of three years is better than six months, which is better than no CAP at all.
I have depicted a simple diagnostic scoring scheme of 1 through 7 and the colors Red for undesirable or inconsistent and Green for desirable or consistent. The notion of “consistent” is to say that just because we are “High” in Cost this may not be undesirable if it is consistent with a boutique high-end strategy with high price points. The mid-point is just that, somewhere in between Desirable and Undesirable. The scoring for the nine Elements is pretty self-evident except for maybe:
Time: Time is either how Fast your Executive, Operating and Support processes are (and with little re-work) and/or how much Time you Save for customers. I view Convenience as part of saving Time. Either one or both aspects can be part of your overall offering for and to customers. Saving Time for customers is often a huge Value for them in today’s world.
Value: Is both customer value and financial value created by good solutions to the other Elements. I have written extensively on Time and Value so I only mention these nuances here.
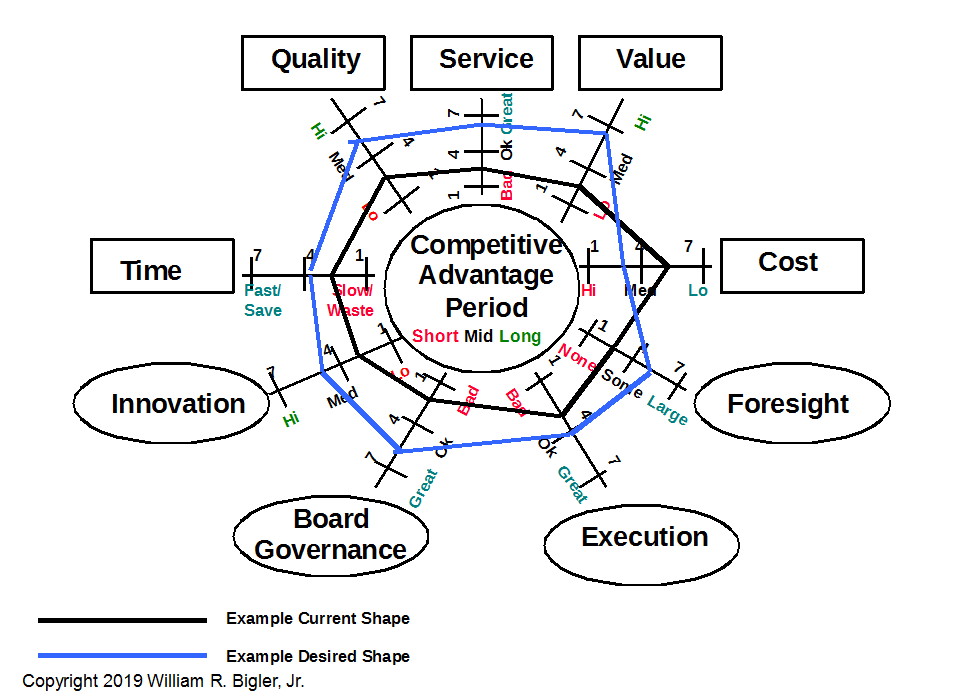
You can set up a fairly quick diagnostic thusly:
- Score where you think your firm resides on the nine Elements and connect as a “spider web” diagram the points for your scores. Color-code this “As-Is” spider diagram. Set out desired improvement scores over a realistic time period. Color-code with a different color. The difference is your Transformation Gap.
Figure 1:The Brushstrokes for Strategic Management
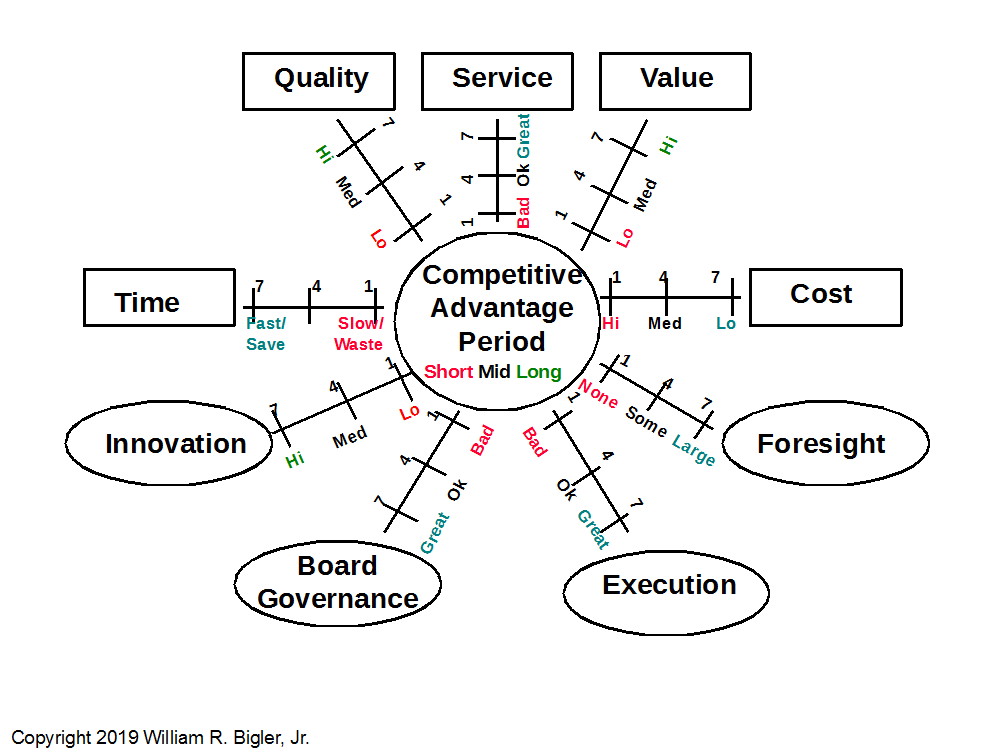
Notice also that Board Governance enters this model for strategic management. Henry Wolfe, who writes on Linked In and has published a great book on Board Governance, Governance Arbitrage: Blowing Up the Public Company Governance Model to Maximize Long-Term Shareholder Value, 2019. Historically we have mandated a board to be hands-off with respect to operating management under the notion that board members needed to be independent to carry on fiduciary and oversight duties only. Henry and others have recently argued for a new governance model for established firms. He and others posit that established firm boards should take on more of the approach that boards of directors in firms in private equity portfolios use. I agree and thus Board Governance takes on more of an operating role in addition to its historic fiduciary oversight role.
- You can score one or two rivals as well and use yet a different color for their spider diagram. Figure 2 depicts such a hypothetical example only depicting a firm’s Current and Desired Condition.
Figure 2: The Spider Diagram
Putting the Nine Elements Into Play
Figures 1 and 2 need a useful approach to implement these chosen and aligned solutions that get much lower than the 30,000-foot level. Many frameworks have been presented over the years. One of the most useful at the 20,000-foot level is the Star Diagram shown in Figure 3.
Figure 3: Strategy and Organizational Alignment – The Star Model
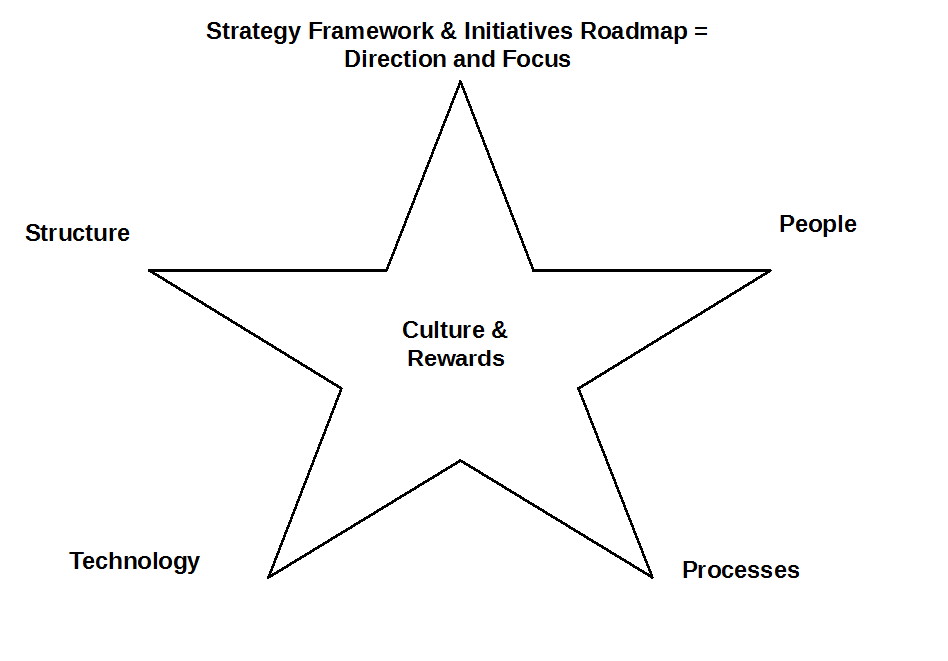
I was first introduced to this framework in about 1988 when I was in the strategy subsidiary of the Hay Group, which then was and still is one of the leading compensation and human resources consulting firms. I have adapted it somewhat over the years to include a firm’s Initiative Roadmap. There is some confusion around who first developed this – Hay Group, Ed Lawler or the consulting firm Delta Group. But it does not matter today as this tool has been in the public domain for a long time now.
The tool is pretty straightforward. Your firm’s solutions for Structure, People, Processes, Technology, and Culture and Rewards need to be appropriate for and align with the firm’s Strategy Framework and Initiatives Roadmap. Easy to say but you know a lot of thinking and hard work is required to do this.
Figures 1 through 3 are useful for depicting what is included and what is directly omitted at 30,000 and 20,000-foot view of generalization. I write “directly omitted” to mean other Sub-elements can be nested within each of the now 15 major Elements. So chances are some of your favorite Sub-elements can be included as a “drill down” of one level of more detail. The 30,000 and 20,000-foot views of things is useful to paint the story without getting lost in the trees or weeds.
But these levels of viewing are not completely useful in aligning how everyone in your firm contributes to securing your firm’s future. Something else is needed. A variety of other tools have been used over the years for this purpose and I Iist some of my favorites here and have used them where appropriate:
- Vision – Mission – Values
- Business Models and Business Canvas
- Your Firm’s Value and Activity Chain (flow from Inbound Logistics to After-Sales Service)
- Resource Based View (owning or controlling valuable, rare and hard-to-copy tangible and intangible assets)
- Dynamic Capabilities (owning very few assets while orchestrating the assets of others in a global portfolio of assets)
- Critical Success Factors (the intersection of what are key trends in an industry and how we survive competition)
- Balanced Scorecard for Alignment
These can help get you closer to aligning every one of your firm’s people to securing its future. But for me, the age-old tool of the Position Description (PD) cannot be overlooked. PDs though go out of date faster than a strategic plan in today’s VUCA world. How can we adapt the PD to serve our purposes in 2019-2020?

Adapting the Position Description: Getting Into the Weeds
The Hay Group in the 1970s developed a very robust method to portray a PD to then help score that job in terms of its value to the firm and align that job’s value to levels of base compensation. Jobs that had more Breadth and Depth were awarded more in base compensation. To be sure there were problems back then with this approach. One way to demonstrate more Breadth and Depth was to have more direct reports. So you guessed it – people were incented to vie for more direct reports. This contributed to the “fiefdom” problem which led in part to the “siloed functions” problem. This has been rectified since then.
In fact, today the PDs I read for new positions are actually very good at suggesting required skills, prior education, training and development, and industry experience. These coalesce in listing that PD’s accountabilities. But what about those PD’s changing so quickly in today’s VUCA world?
If we simply add the Deliverables to the PD, we get closer to a more fluid depiction of that job or role and its contribution to securing a firm’s future. Every employee has an ID number. It is possible to every week assign that People ID # with its Deliverables to different units of a firm. So say this week my time is to be doled out a third to this profit center, a third to this cost center, and a third to yet another revenue center. What remains constant is that PD’s Deliverables. Now I realize this creates a situation where this particular employee will have three bosses for a period of time. But this arrangement was foreshadowed by matrix organizations and many firms work this way today without stating it. For instance, when I was in two global consulting firms, we worked in a four-way matrix organization. We had subject matter leaders, geographic leaders, industry leaders, and fifteen or so global leaders.
As the world changes and the solutions in Figures 1 through 3 change, these cascade into changing PDs, especially changing Deliverables.
So there we have it. This article has presented one approach to zooming in from 30,000 feet to in the trees or weeds and back again. Its purpose was to provide an approach to helping firms secure their futures while engaging every single employee in helping to secure that future. What would you suggest to enhance this approach?
This article is part of a series on what causes a firm’s value to increase.
Dr. William Bigler is the founder and CEO of Bill Bigler Associates. He is a former Associate Professor of Strategy and the former MBA Program Director at Louisiana State University at Shreveport. He on served on the Board of Advisors for Nitro Security Inc. from 2003-2005 and was the President of the Board of the Association for Strategic Planning in 2012. He is the author of the 2004 book “The New Science of Strategy Execution: How Established Firms Become Fast, Sleek Wealth Creators”. He has worked in the strategy departments of PricewaterhouseCoopers, the Hay Group, Ernst & Young and the Thomas Group among several others. He can be reached at bill@billbigler.com or www.billbigler.com.