
We normally think of Competitive Advantage (CA) as a cost or price (sometimes a dual) position in a competitive environment relative to rivals. Thus CA can be thought of as a state or in a static notion. Proponents of the positioning school of CA do say that positions change over time, but at any given time period a firm’s position is discussed and presented as a state proposition. Positions are depicted as needing to be defended, thus contributing to a more static or state notion.

This article will introduce an approach for CA that is dynamic and thus is a flow or a speed or a rate notion. The Positioning School is not out in my view. My dynamic view is a complement to the positioning view of CA.
As usual lately, I will rely on as little verbiage as possible and use a series of figures and exhibits from a PowerPoint file to tell my story and make my arguments. Folks are busy and this approach will hopefully allow timely assimilation of some slightly more advanced concepts. I have also tried to make this a stand-alone article, but if you are interested in a little more depth I have published several articles on my causal model of strategy and firm valuation on Linked In and here on this website.
The Five Wave Causal Model of Competitive Advantage and Firm Valuation
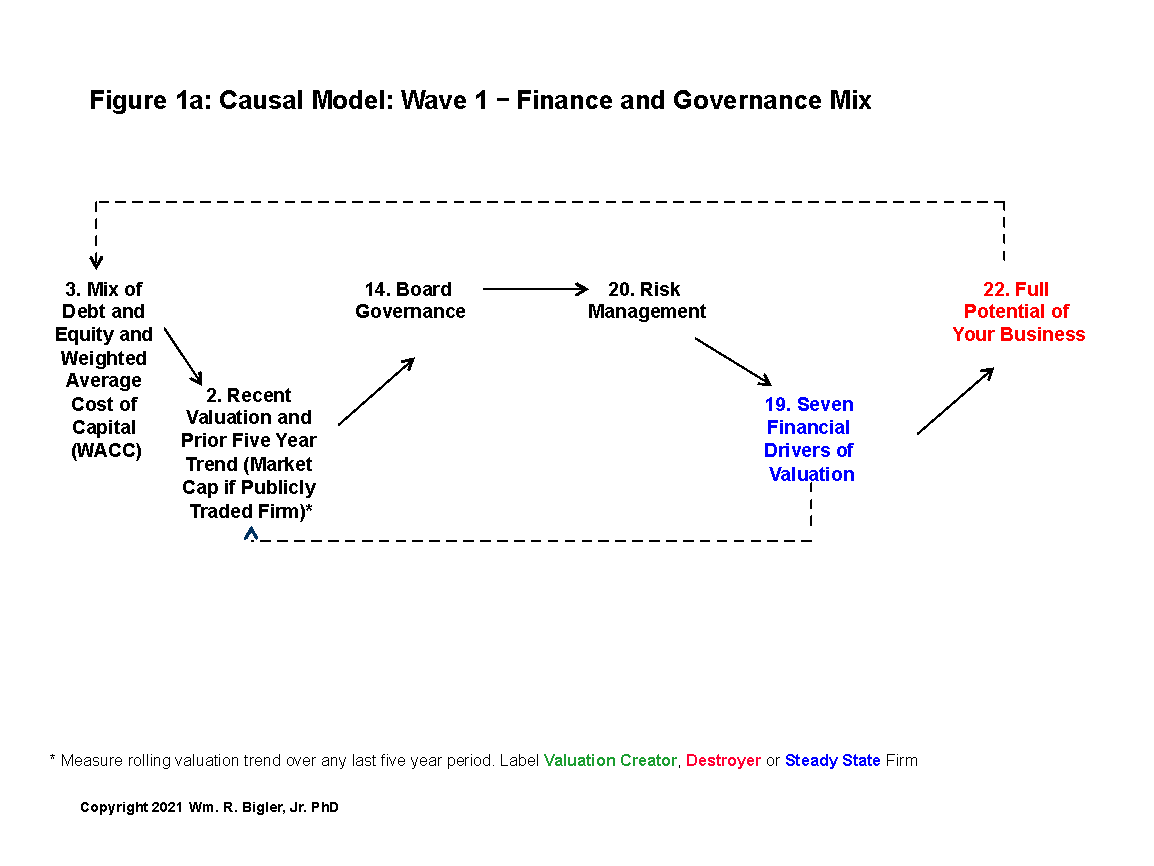
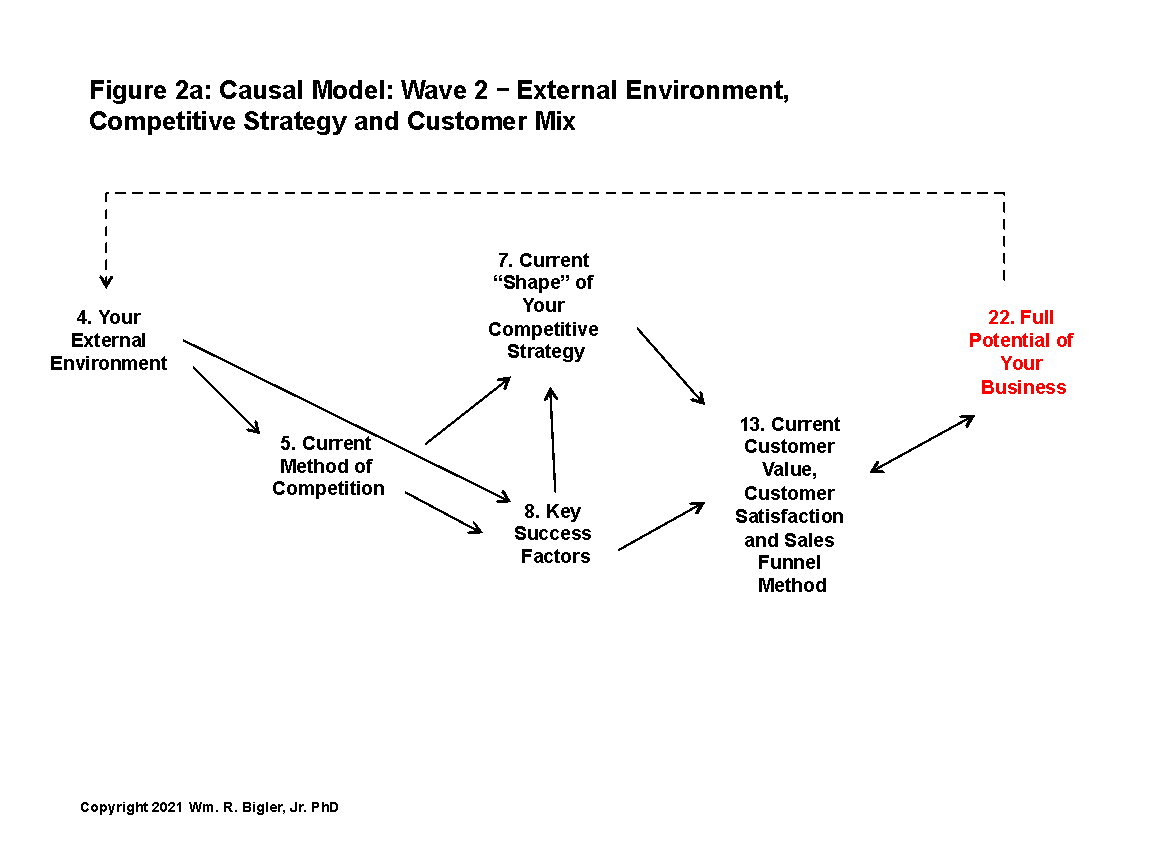
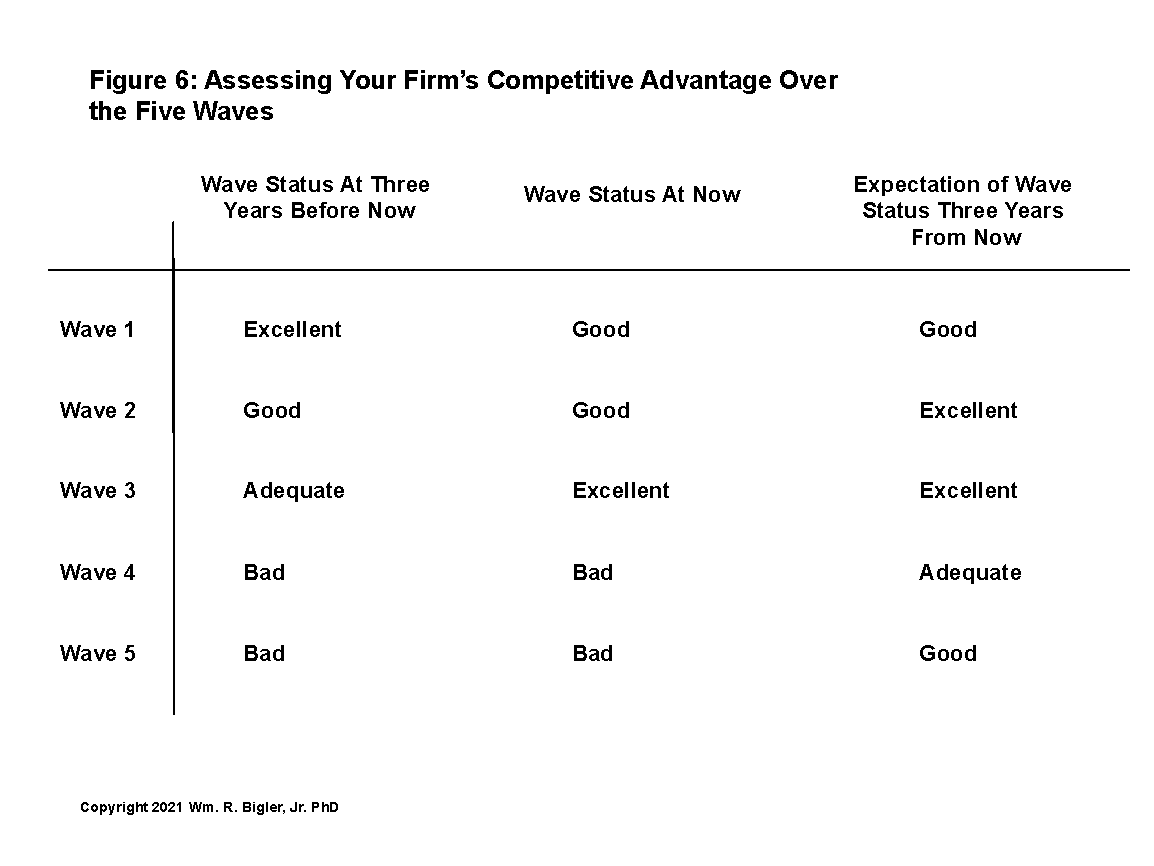
The following exhibits will portray my Five Wave Causal model of what drives competitive advantage and financial value creation. After each slide of the model, I will show how we can measure competitive advantage as flow or rate or speed. Each Wave is part of the picture and Figure 6 will summarize the five Waves for contribution to overall firm competitive advantage.
A few items first:
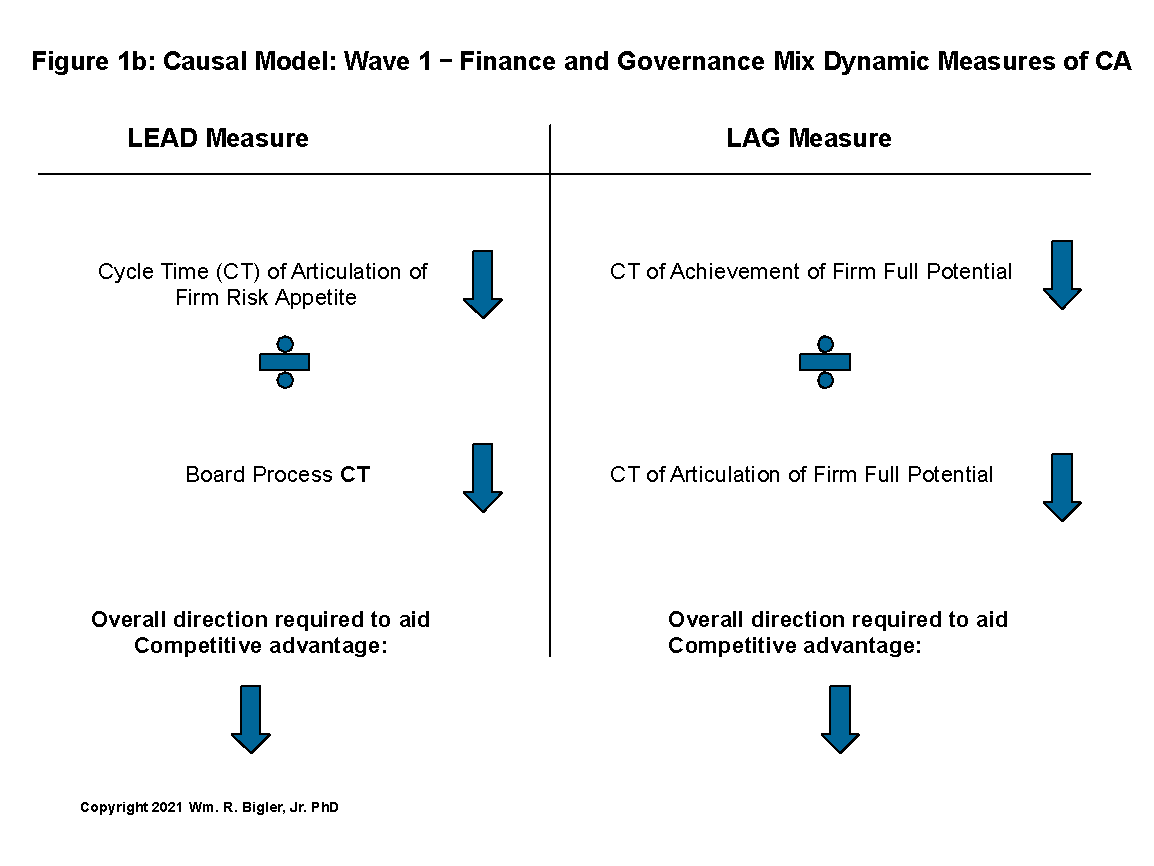
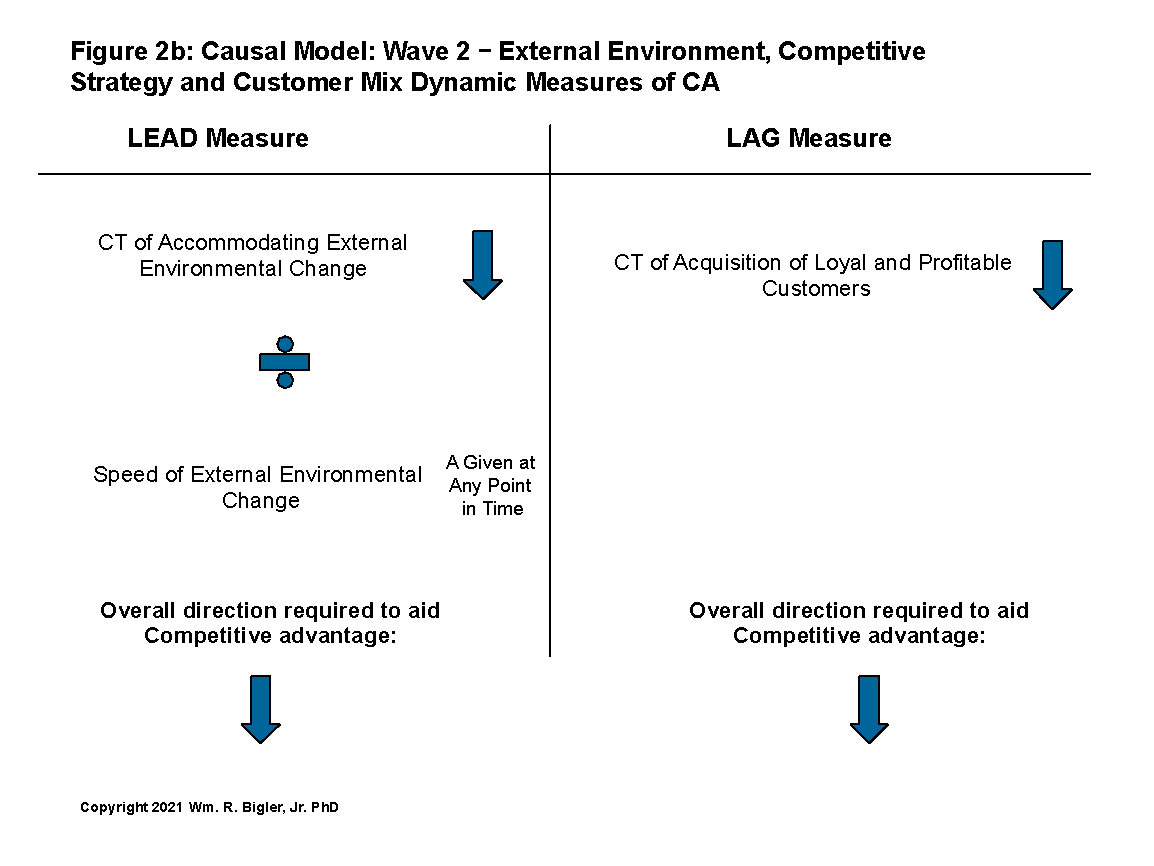
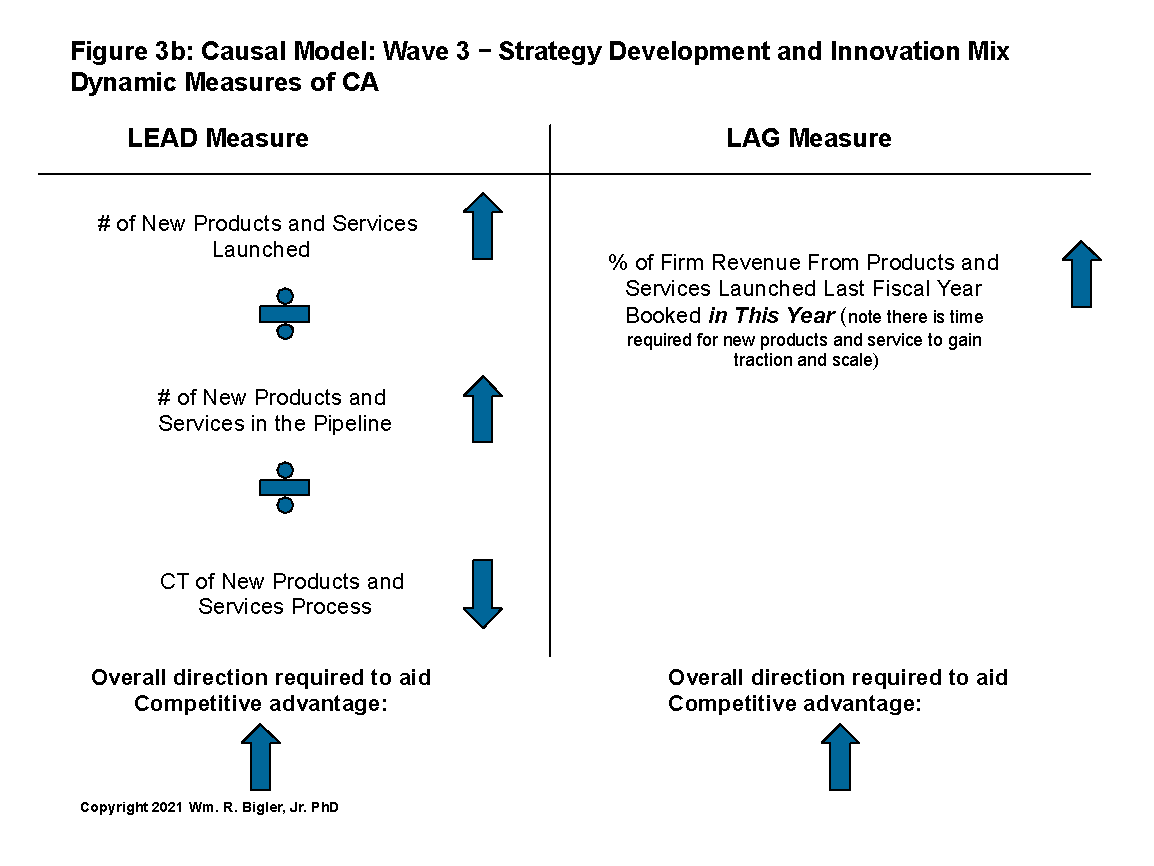
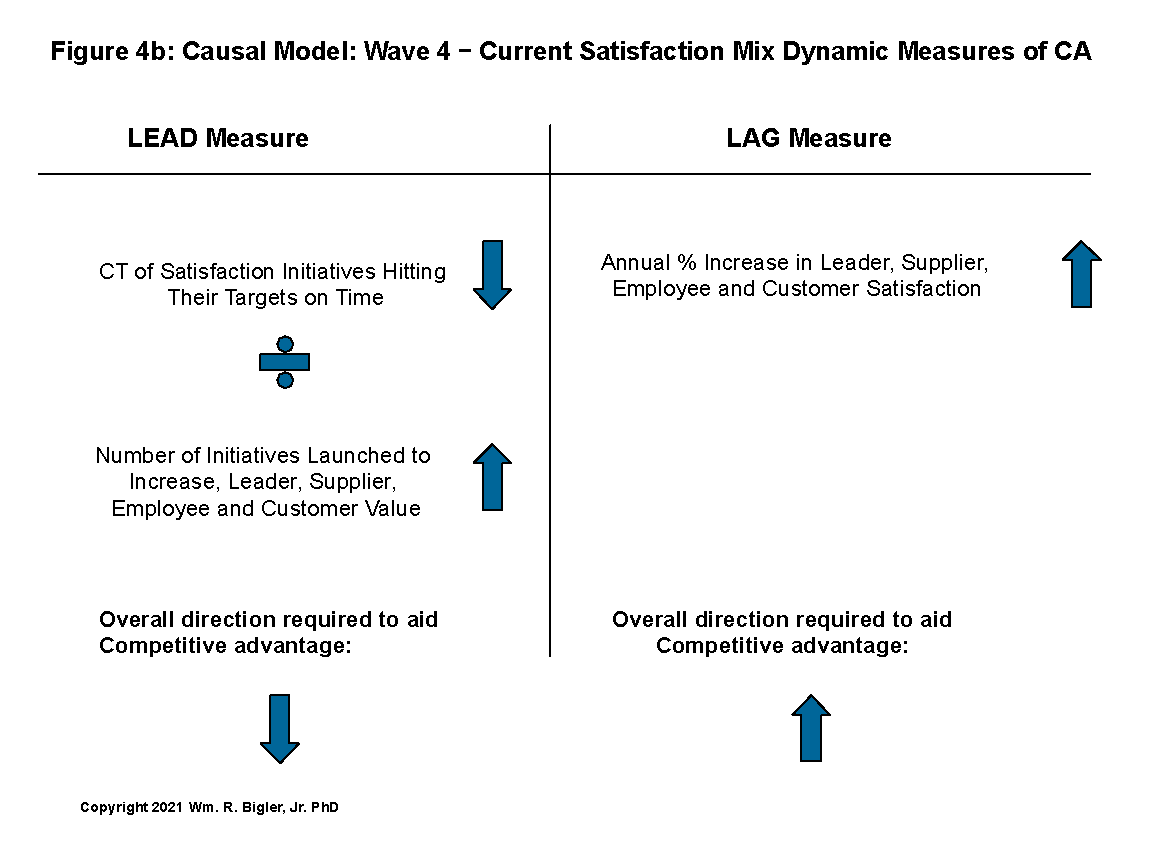
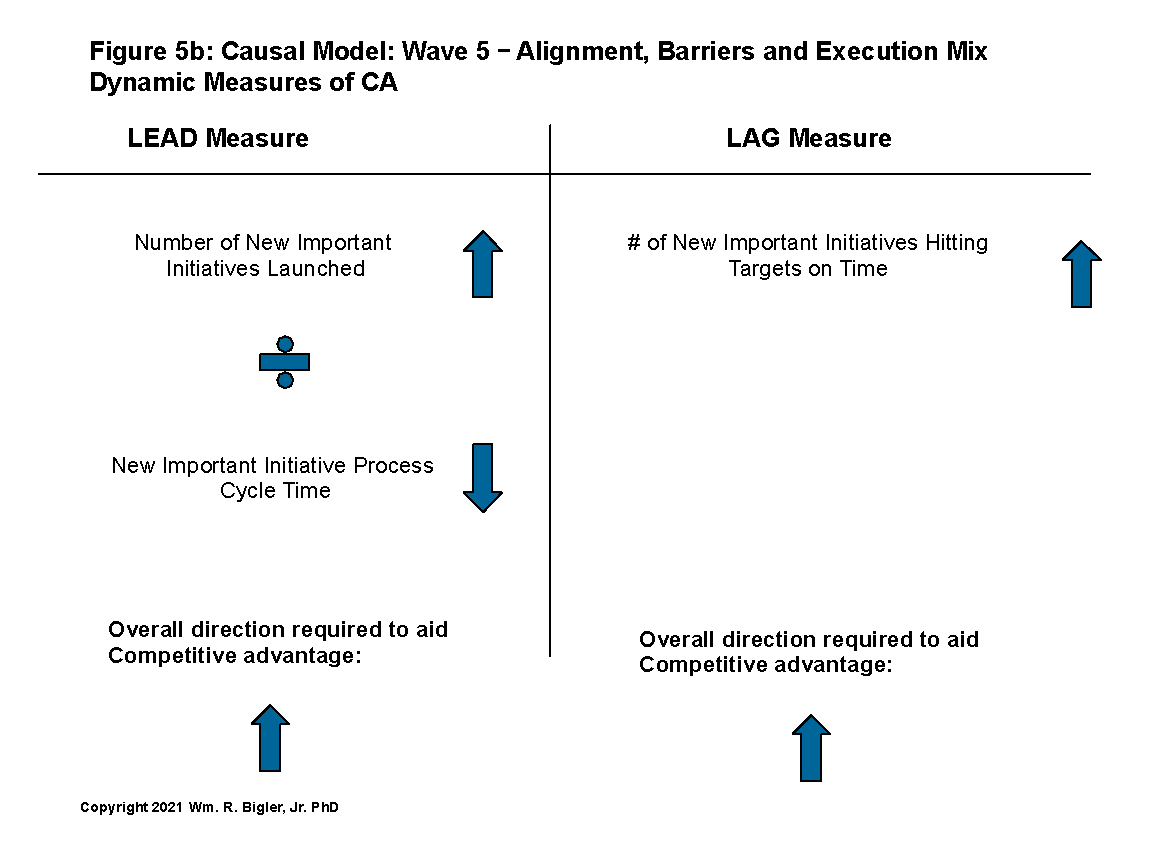
- CT equals Cycle Time. This is a measure of process speed.
- You will see in the Measures slides various measures presented as ratios. That is as a numerator and a denominator and in one case two denominators. These really do not result in a number per se. They just combine logically grouped rate, speed or flow measures. Use these as diagnostics. For instance, if the denominator is improving, why isn’t the numerator? However for those of you who are math oriented, I have included at the bottom of each measure set an up or a down arrow showing the direction of the overall ratio required for contribution to Competitive Advantage (CA).
- You will see I provide Lead and Lag measures in each of the Five Waves. Thomas Group is the first entity from which I learned the notion of Lead versus Lag measures. This was followed up with the Balanced Scorecard and now many others. These measures have worked for my clients and me over the years. But you can devise custom measures for your firm and industry that are more specific to your needs.
Here we go:


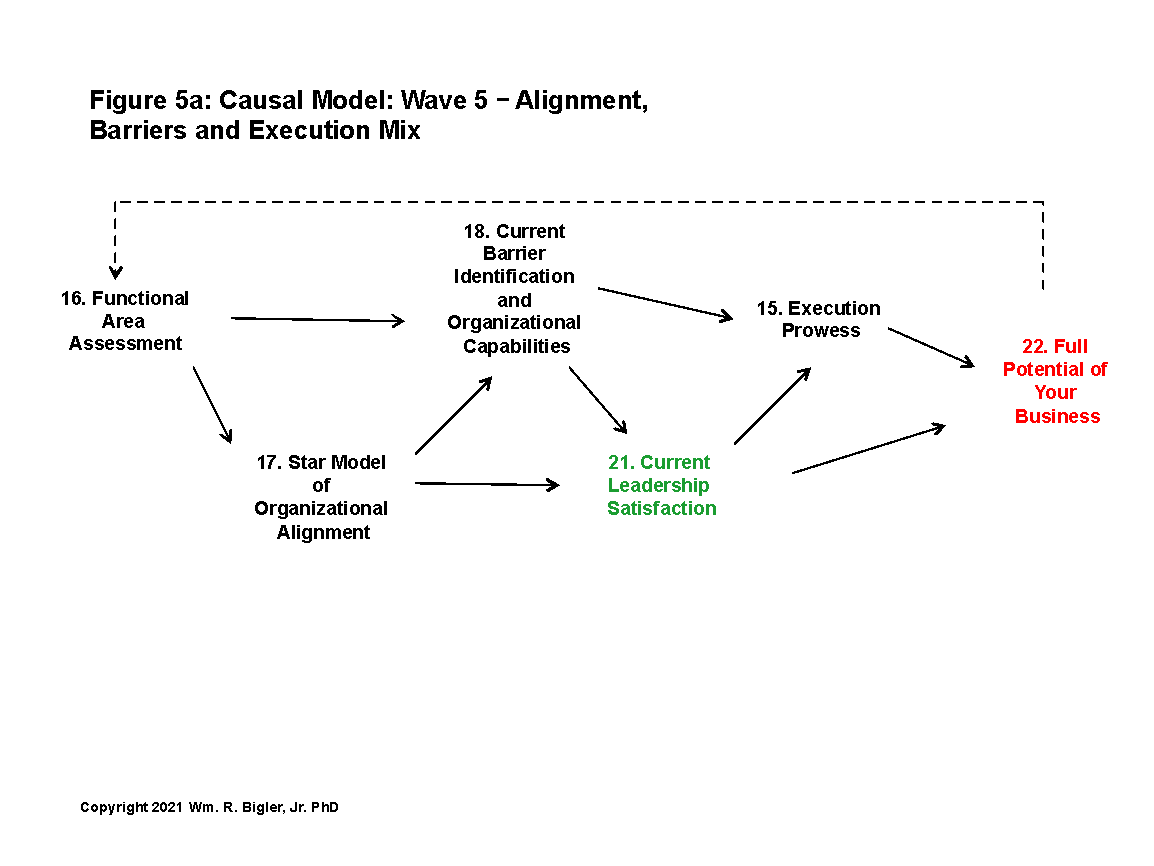
Assessing Your Firm’s Competitive Advantage Over the Five Waves
Figure 6 is one example of how you can assess your firm’s Competitive Advantage (CA) over the five waves. This comparison is over time frames for your firm – say three years ago, now and what the expectation is three years from now.
There is an issue though with this entire approach relative to the knowledge we gain from the traditional view of CA as position vis-à-vis rivals. There is no absolute standard yet from which to assess and judge if your firm really has a dynamic CA. Enter Figures 7 and 8 from the position school:

As shown in Figures 7, the advantaged Low Cost Provider can Price at the Average Industry Price Line but its cost per unit sold is the lowest in the industry.
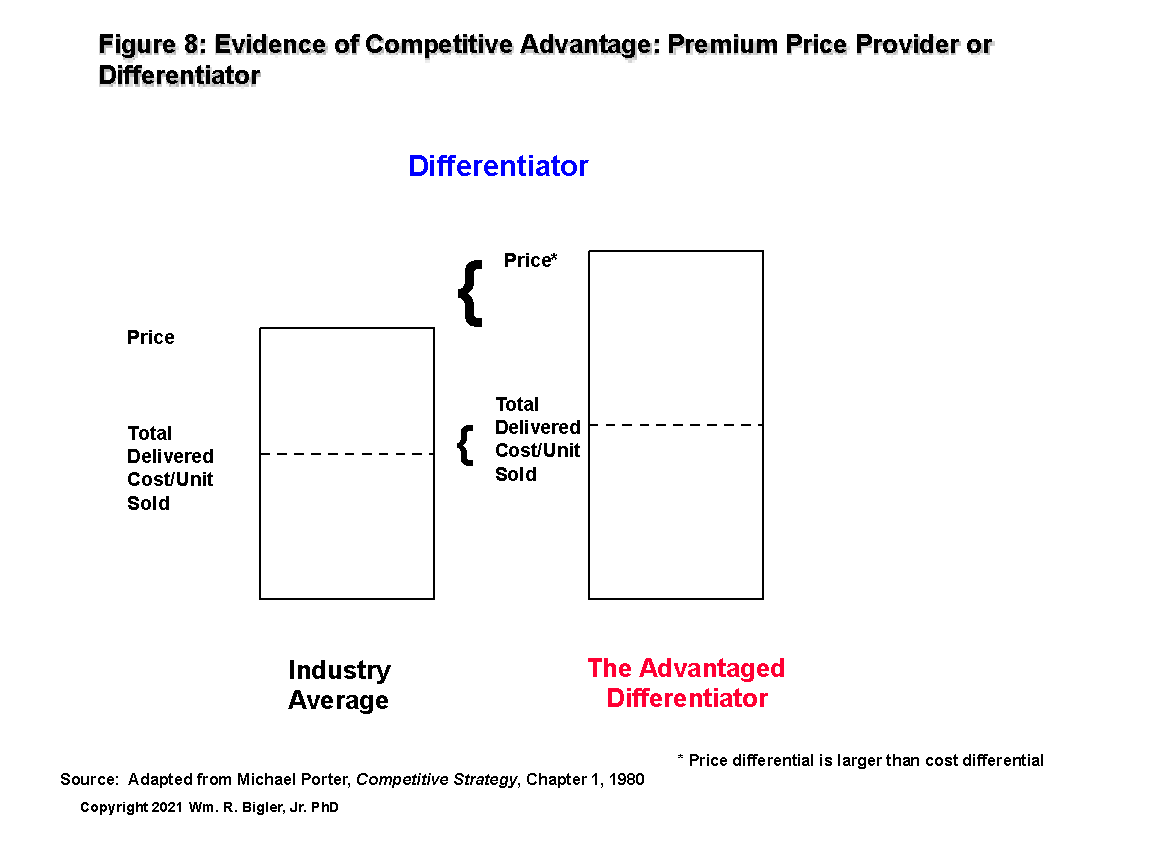
For the advantaged Differentiator shown in Figure 8, that firm has higher cost per unit sold than the industry average, but its Prices are at a premium level relative to the industry average Price Line. The Price differential is always larger than the Cost differential for the advantaged Differentiator. And this is key: the industry Price line can be measured and the industry Cost Line can as well although with less certainty. These measures provide an absolute standard from which you can declare your firm enjoys either a Low Cost or Differentiator CA.
Notice these measures are all related to the Income Statement – Prices and Costs. For the dynamic approach to have teeth, we must posit and measure the positive effects of rate/flow/speed on prices, costs and investment effectiveness. Of course investments are represented on the Balance Sheet. As far as effects on Costs, rate/flow/speed offer the familiar learning or experience curve effects. As far as effects on Prices, Wave 3 offers the effects that Innovation can supply towards more premium prices. More New Products and Services, offered more frequently, allow for a higher probability that more premium prices can be charged and accepted by customers. This stems also if saving time for customers is part of the value proposition of those products and/or services. And the ability of B2B customers to have access to a product or service first before rivals, and maybe locking some rivals out, offers a premium price possibility.
The positive effects on investment stem from more “cycles of learning” to aid in effective investment of working capital and fixed capital by not making as many mistakes. Think about this: if a key process cycle time is one year, there is only one cycle of learning per year. If the cycle time is reduced to every three months, there are four cycles of learning per year. More cycles of learning are almost always a favorable thing.
The reality is some firms in their industries do indeed exhibit a dynamic CA as measured by the Lead and Lag measures over the Five Waves. While we can measure and assess our firm, this is difficult to do with rivals. We can make guesses but we cannot know for sure.
Does this statement nullify this dynamic approach to CA? I don’ think so and this is why my next research project will investigate how we can find and measure the dynamic CA numbers of rivals and make a more absolute statement as to whether we have a rate/flow/speed advantage over those rivals.
References
- Bigler, William R., “A New Vista for Strategic Management: Continuously Aligning the Inside with the Outside”, Management Accountant’s Quarterly, Spring 2019.
- David Holland and Bryant Matthews, Beyond Earnings: Applying the Holt CFROI and Economic Profit Framework, Wiley, 2018, 383 pages.
- Bartley J. Madden, Value Creation Principles, Wiley, 2020, 250 pages.
- Bartley J. Madden, Maximizing Shareholder Value and The Greater Good, LearningWhatWorks, 2005, 54 pages.
- Greg V. Milano, Curing Corporate Short-Termism: Future Growth vs. Current Earnings, Fortuna Advisors, 2020, 351 pages.
- Cynthia A. Montgomery, The Strategist: Be the Leader Your Business Needs, Harper Business, 2012, 189 pages.
- Felix Oberholzer-Gee, Better, Simpler Strategy: A Value-Based Guide to Exceptional Performance, Harvard Business Review Press, 2021, 288 pages.
- Alfred Rappaport, Creating Shareholder Value: The New Standard for Business Performance, Free Press, 1986, 270 pages. Revised edition 1998, Free Press, 205 pages.
- Michael Porter, Competitive Advantage: Creating and Sustaining Superior Performance, Free Press, 1985, 557 pages.
- Bennett Stewart, The Quest for Value, Harper Business, 1991, 800 pages
This article is part of a series on what causes a firm’s value to increase.
Dr. William Bigler is the founder and CEO of Bill Bigler Associates, an independent research boutique at the intersection of competitive strategy and shareholder value. He is a former Associate Professor of Strategy and the former MBA Program Director at Louisiana State University at Shreveport. He was the President of the Board of the Association for Strategic Planning in 2012 and served on the Board of Advisors for Nitro Security Inc. from 2003-2005. He is the author of the 2004 book “The New Science of Strategy Execution: How Established Firms Become Fast, Sleek Wealth Creators”. He has worked in the strategy departments of PricewaterhouseCoopers, the Hay Group, Ernst & Young and the Thomas Group among several others. He can be reached at bill@billbigler.com or www.billbigler.com.