
This article will present a simple and linear looking process to aid the board of directors in helping to drive increases in shareholder value (SHV) in the publicly traded firm. But the principles apply to private for-profit firms as well as they try to maximize owner wealth. If the reader would like a little more background, please see A General Theory of Valuation and One Casual Model of Increasing Firm Valuation.
Simple does not mean easy and behind the linear look of the process, there are a lot of dynamics going on. And as the reader will see, this ‘board’ process has huge implications for corporate culture change in many firms. Thus in the article, I hope to lay out the process and culture required for boards of directors to really up their games.

Why We Need This Process
Research has shown that many members of publicly traded firms do not understand how SHV is created and grown. This surprises me with the hundreds of thousands of MBAs who have graduated over the last twenty or so years. But my experience bears this out. To date, I have served on only one board and it was an Advisory Board of a start-up and not a legal fiduciary board. Still, I have known many board members over the years. Some understood SHV principles but most did not. This article will make an appeal that boards must be trained in SHV if they lack this knowledge. The training and education should be at the level of principles and not financial detail. This article’s main message is that a board-level process might be a way to provide a roadmap for boards and light a fire underneath them. Let’s get on with the article.
I. A Board of Directors’ Process for Maximizing Shareholder Value
Figure 1 depicts a “Level 0” process for the board to use to help drive increases in SHV:
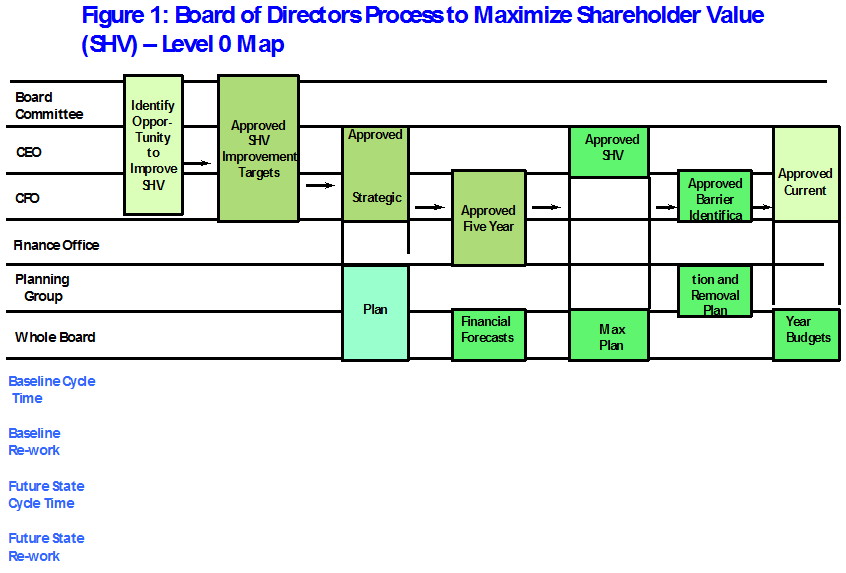
First a few brief comments on this kind of process map. There are at least several ways to depict executive, operating and support processes for management use. Software development uses a whole other approach. I learned my process disciplines at Thomas Group twenty-four years ago and this is how they mapped processes. Then in the 1996 time frame, they were one of two leading operations excellence consulting firms. I was hired to co-lead a group that would try to develop a competitive strategy practice that would bolt onto their tremendous operations excellence knowledge. It was the best two and a half months of my career.
Level 0 means this is the highest generality of the process. Level 1 explodes to give more detail and Level 2 even more. For management purposes, you never need to go below Level 2 and I like stopping at Level 1 if you even need to go there. I will forgo Level 1 and 2 maps in this article.
You will notice at the left of the process map are the entities/positions that touch the process first, second, third, etc. in the order from top to bottom. Here is a key point: these entities/positions are the “Prime Movers” (PM) for the activities in the “swim lanes” from left to right in the map. This means they are held accountable to get the activity Approved. Always the prime movers seek and accept advice and help from others to get the activity approved but they are the ones held accountable to get it done. This is why at this Level 0 all of the activities, except for the first one, from the left are described as being Approved. If not, we could confuse effort with getting something approved on time. Let’s now discuss the Activities from left to right:
- Identify Opportunity to Improve Shareholder Value (SHV)
Prime Movers: Board Committee, CEO, CFO
The realization that there is an opportunity to improve SHV should be obvious in many firms. All the board and senior management needs to do is to assess the direction of their stock price over a rolling fifteen or so month period. If it is declining, obvious warning signs should be clear. But there is a more difficult opportunity to assess: what is the growth potential for SHV as a firm identifies and moves to its “full potential”. This is the opportunity to improve SHV that boards should be investing much more time and energy into.
The designation of the CEO and CFO Prime Movers (PM) is fairly obvious. But notice I list only the phrase Board Committee for that PM. This is because as of now there is no clear board committee that has or should have accountability for SHV maximization. Here is the list of the typical board committees in a publicly-traded firm:
- Audit Committee
- Shareholder Grievance Committee
- Remuneration Committee
- Risk Committee
- Nomination Committee
- Corporate Governance Committee
- Corporate Compliance Committee
- Ethics Committee
Of these, there is no clear choice to house SHV maximization accountabilities for the board. Maybe the Risk and Corporate Governance committees could be enhanced with SHV maximization accountabilities, but I do not think this is ideal based on my experience. In the concluding part of this article, I will make the case for the formation of an SHV Maximization Committee.
- Approved SHV Improvement Targets
Prime Movers: Board Committee, CEO, CFO
This activity sets out approved SHV improvement metrics and targets for those metrics. I have written here in other articles about the classic financial drivers of SHV:
- Revenue growth rate
- Operating profit margin growth rate
- Incremental working capital investment
- Incremental fixed capital investment
- Tax rates
- Weighted Average Cost of Capital (WACC)
- Competitive Advantage Period (CAP)
These financial metrics and ensuing targets and expected improvements to CAP would culminate in a stated and approved target of the desired stock price relative to the current stock price and in what time frame the improvement is expected. We could add other metrics such as:
- The desired position of Total Shareholder Return rank compared to other publicly traded competitors and over what time period for improvement.
- Targets for creating the largest spread possible between Cash Flow Return on Investment and the WACC. This is the acid test for firms to create and grow SHV.
- Cycle Time to Approved Strategic Plan
3. Approved Strategic Plan
Prime Movers: CEO, CFO, Planning Group, Whole Board of Directors
This should be an obvious activity. But here I will say this ‘board’ process is agnostic to the method and process to create the strategic plan. Hundreds if not thousands of approaches exist and the only requirement is that the approach and strategic planning process works for the firm. Of particular interest to the board should be the suggested and approved new strategic initiatives. More on this in Activity 5.
- Approved Five Year Financial Forecasts
Prime Movers: CFO, Finance Office, Whole Board
This Activity builds from Activities 2 and 3. Included in the five-year financial forecasts should be:
- Revenue
- Expenses
- Net income
- Balance sheet items
- Normal Cash flow
- Free cash flow discounted to the present at the WACC and compared to current levels of free cash flow.
- Subtract debt and other items to arrive at the expected present value of shareholder value.
- Divide by the number of shares outstanding to get to Implied Stock Price and compare to Current Stock Price. If Implied is greater than Current, you are expecting to grow SHV. If Implied is less than Current, revisit assumptions, strategic plan, and new initiatives and re-plan. Note this introduces Re-work, which is not good, described below.
- Approved Shareholder Value Maximization Plan
Prime Movers: CEO, Whole Board
This plan will be similar to the Private Equity (PE) approach to improve the value of the companies that form their portfolios. Here three to five of the new strategic initiatives presented in Activity 3 – Approved Strategic Plan, will be launched with laser-like focus. The new initiatives are the ones that are felt will have the biggest impact on improving SHV. Also, prior approved initiatives that may have stalled for one reason or another will come under scrutiny.
The method to choose the right three to five initiatives is one of the “holy grails” of business strategy and operations excellence. Every PE firm has their own “secret sauce” to do this and is one of the supposed reasons for “outsized PE returns” or alpha as it is called. I have my approach but every firm needs to develop its own. Here is where the board of directors has a chance to really shine. They do not determine the initiatives, but their oversight and their networks of individuals, firms, resources should be accessed for this crucial activity in the process.
- Approved Barrier Identification and Removal Plan
Prime Movers: CFO, Planning Group
This is a unique aspect of this process and is also the most revolutionary Activity in this ‘board’ process. I have written in other articles here Four Kinds of Barriers in the Established Firm that there is a science to barrier identification and removal. All for-profit firms have a mix of four kinds of barriers. The subject matter, process, structure, and culture barriers can plaque a firm’s processes and activities. The best-run companies only have subject matter barriers. Any firm that is innovating will have new stuff to learn and thus face subject matter barriers. While these can be thorny, they are the easiest to identify and remove. Process, structure, and culture barriers are a different matter and can be very troublesome.
Identifying barriers can be career-limiting for the people who raise them. The only way to provide a safety net to those individuals is not simply to say “Don’t shoot the messenger”. The solution is developing, if one does not exist, a corporate culture of “transparent meritocracy”. Here results over effort are valued and the key way to do this is the speedy identification and removal of the mix of barriers. In a culture of transparent meritocracy, there is no place for people or an effort to hide. So people might as well be honest and objective and call barriers as they seem them. A formal sub-process of Barrier Identification and Removal provides legitimacy and visibility to get this most important work accomplished.
The reader might be asking why a separate Activity to Identify and Remove Barriers and why not include this work in the SHV Maximization Plan? After all the SHV Maximization Plan covers only the key new initiatives expected to have the greatest leverage to increase SHV. But while most firms have almost issues with barriers in the ongoing work of the firm as well, it is best to focus on the barriers that will affect the key new initiatives only. As this board process cycles over time, yet newer initiatives will be launched and the Barrier Removal Team will get to work on other parts of the organization anyway. So larger coverage will ensue naturally.
Notice that this Activity is placed before the Activity of Approved Current Year Budgets. This placement makes sure the budgets are done and approved to accommodate any expenditure to identify and remove the four kinds of barriers, as well as investment in the new initiatives themselves.
- Approved Current Year Budgets
Prime Movers: CEO, CFO. Finance Office, Planning Group
This Activity of the process is very familiar. The only comment here is that annual or current year budgets should be fluid and allowed to morph and change during the current year to accommodate other Activities in this board process that could change during the year.
II. Process Metrics
Figure 2 fills in the rest of the information that is required for this kind of a board process to be effective:
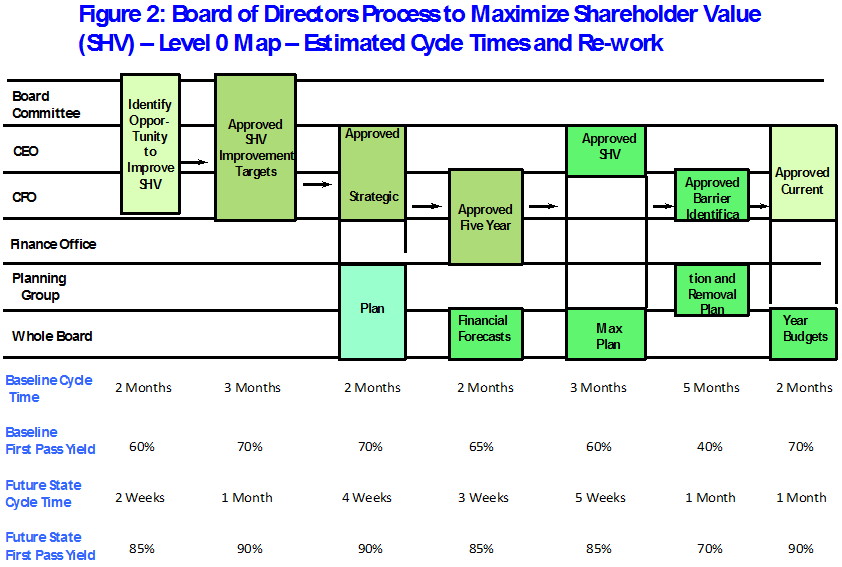
Two key process metrics are important: process cycle times and the amount of re-work in the process and its sub-processes and Activities.
- Process cycle time – is the elapsed calendar time for start to finish of one cycling of the process or sub-process.
- Re-work – Thomas Group referred to re-work in a process or parts of the overall process as “first-pass-yield” (FPY). This is the percentage of the number of cycles a process runs where inputs pass through it with no re-work. An FPY of 100% means there is no re-work. An FPY of 70% means that in 30% of the cycles of the process re-work happens. Re-work is very frustrating and vigilance and good process design must minimize this as much as possible.
There is a relationship between re-work and cycle time. The higher the re-work the longer the cycle time. The root cause of too long of a cycle time in a process or sub-process and too much re-work is always found in the four kinds of barriers.
Figure 2 displays hypothetical Baseline (Current State) cycle times and FPYs and desired Future State cycle times and FPYs. Every firm is unique and needs to measure its situation. While the numbers are fictitious the level of Baseline measures and the improvement potential at Future State are consistent with my experience. There is almost always this kind of improvement potential in a management-oriented process when it is worked for the first time. In nearly every case of our diagnostics, management teams were surprised at how long things really took and the amount of frustrating re-work that was going on. For example, our diagnostics at a leading lighting manufacturer showed the baseline cycle time to bring any new lighting initiative to market was a whopping seven years with an overall FPY of 40%. We benchmarked against Philips Lighting and GE Lighting and two agile small manufacturers and found the Future State cycle time needed to be fourteen months with an FPY of 80%.
In our hypothetical case in Figure 2, the elapsed Baseline total cycle time through the seven activities is 19 months with an average FPY of 62%. The elapsed Future State total cycle time is 20 weeks or 5 months with an average FPY of (85%). This is the kind of improvement potential boards should be seeking. This is an X% reduction in cycle time and a Y% increase in FPY.
III. Implications for the Board of Directors Using This Process
Every executive, operating and support process should be designed and managed for speed and little re-work. So should this board level process. But as we saw from our discussion in Activity 1, there are currently no current board committees that can reasonably take on this work.
This is why I think there needs to be a new board-level committee formed, tentatively titled the SHV Maximization Committee. Its chair needs to have solid process disciplines knowledge and experience. He or she needs to measure baseline cycle time and FPY, set out future state metrics, and identify and remove barriers to get to the future state metrics.
Notice again the Activities in this process are described as having things Approved. Each of those activities will have to interface with Level 1 processes of strategic planning, making five- year financial forecasts, and the process of identifying and removing barriers. Note most firms do not have a formal barrier identification and removal process. This should be added as well in my view and is in Activity 6.
If the ideal cycle time of this process gets to five months, which I think is reasonable, a few will have a little over two “cycles of learning” in a fiscal or calendar year (12 divided by 5 = 2.1). Over a course of five years, ten plus Cycles of Learning will give the firm a nice reservoir of knowledge on how to most efficiently and effectively increase SHV. If the reservoir only gets larger as time goes on, then this process in and of itself will increase the value of the firm should it ever be sold.
In our times of 2020, boards of publicly traded firms and private for-profit firms now have a tool and supporting culture to make a big difference. No process can ensure SHV increases as good people are required to make this happen. But a good process with its drumbeat of the timing of key Approved Activities is a good start.
This article is part of a series on what causes a firm’s value to increase.
Dr. William Bigler is the founder and CEO of Bill Bigler Associates. He is a former Associate Professor of Strategy and the former MBA Program Director at Louisiana State University at Shreveport. He was the President of the Board of the Association for Strategic Planning in 2012 and served on the Board of Advisors for Nitro Security Inc. from 2003-2005. He is the author of the 2004 book “The New Science of Strategy Execution: How Established Firms Become Fast, Sleek Wealth Creators”. He has worked in the strategy departments of PricewaterhouseCoopers, the Hay Group, Ernst & Young and the Thomas Group among several others. He can be reached at bill@billbigler.com or www.billbigler.com.