This is Part 2 of the article published last week. For those who missed Part 1 and would like to read it here is a link (Part 1).
I will review the section covering Figure 1 from Part 1 below to orient new readers. Then I will discuss the fourth and fifth examples of how we might link competitive strategy frameworks with value creation principles, most often discussed as creating and growing shareholder value (SHV). I am very mindful of the current debate over shareholder capitalism versus stakeholder capitalism. This discussion must be tabled though for this article. And as I mentioned in Part 1, other strategy frameworks could be used here. Roger Martin’s framework in Playing to Win comes to mind, as do others.
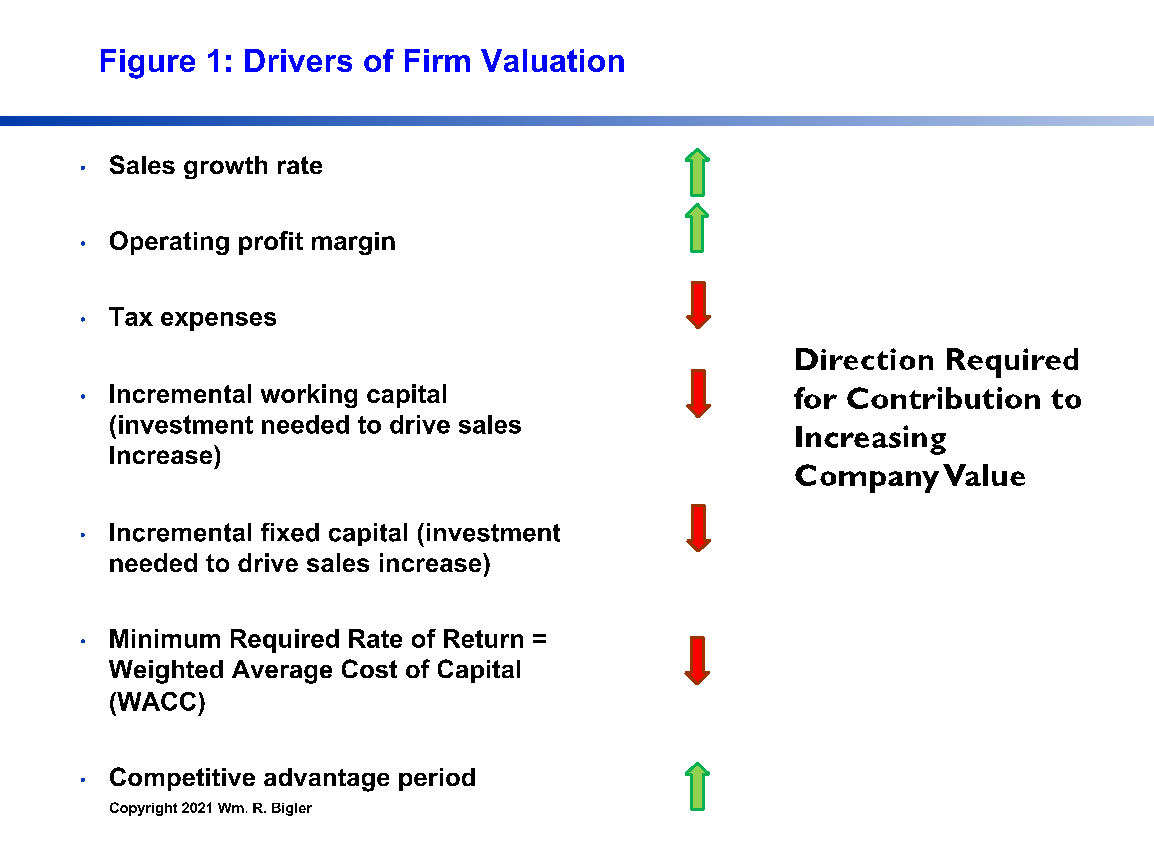
Figure 1 depicts the classic purely financial drivers of SHV for publicly traded firms or what I call Owner Wealth for private for-profit firms (Rappaport 1986 and 1998 rev):
One can see the direction required for each Driver to contribute to creating and growing SHV. Competitive Advantage Period might be new to some readers so here is a link to an article I wrote on this last year (Competitive Advantage Period). But it is basically the length of time into the future the firm expects to maintain some form of competitive advantage.
All five examples in Parts 1 and 2 suggest how a particular framework of CS impacts groups of the seven financial Drivers from Figure 1. Here is a key observation: these measures are improved through the mechanism of the firm’s competitive strategy (CS) reducing what financial professionals call Fade. Fade is a law of finance that says absent some form of innovation, a firm’s free cash flow return on investment (FCFROI) will fade or degrade over time to the long-run average return across all industries. This FCFROI number is around 6%. And as Fade increases, CAP decreases.
Example 4: The Business Performance Engine Approach
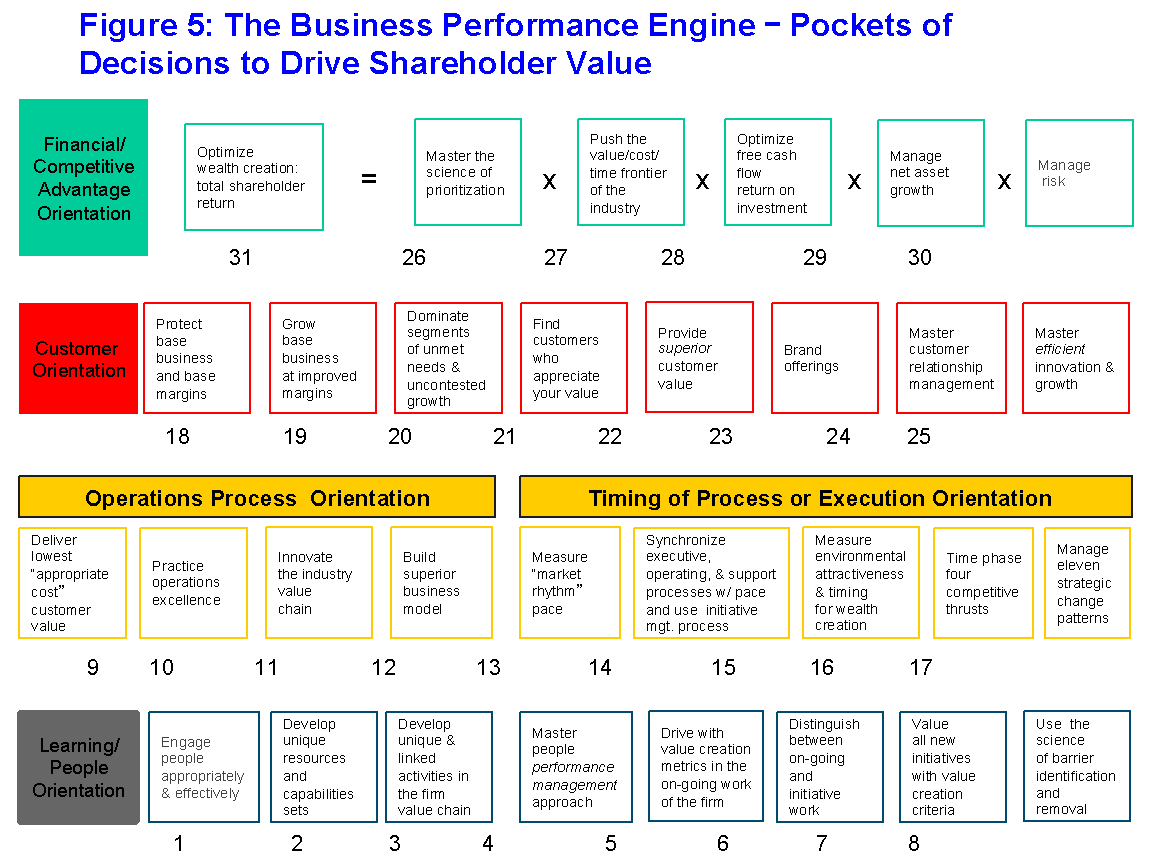
Figure 5 was first developed around 2005 and I have been developing and improving it since. I have several articles on this framework here and will not repeat the details (The Business Performance Engine: A Revolutionary Approach). I also have a published article on this in Management Accountant’s Quarterly (Spring 2019). Please see citations at the end of this article if you are interested.
This Business Performance Engine (BPE) framework was organized in the Balanced Scorecard (BSC) categories in 2005 because the BSC was so popular back then. But the Business Performance Engine (BPE) is totally different than the BSC. The thirty “Pockets of Decisions” (PODs) emerged from my academic research over the years through a statistical technique called factor analysis. This technique groups like individual variables to form an overall theme or “factor”. Thus these thirty PODs actually “stand for” about 260 discrete variables.
For the purpose of this article, I ask the reader to just peruse the four BSC categories nesting the thirty PODs to get a flavor for the kinds of decisions that need to be made.
While all thirty PODs are important as themes (they are necessary and sufficient), typically only five to seven are critically important at any one time. The high priority PODs have decisions within them that need to be made by the top management team at the time they need to be made, not before or after. Figure 5 as depicted is a static “canvas of decisions”.
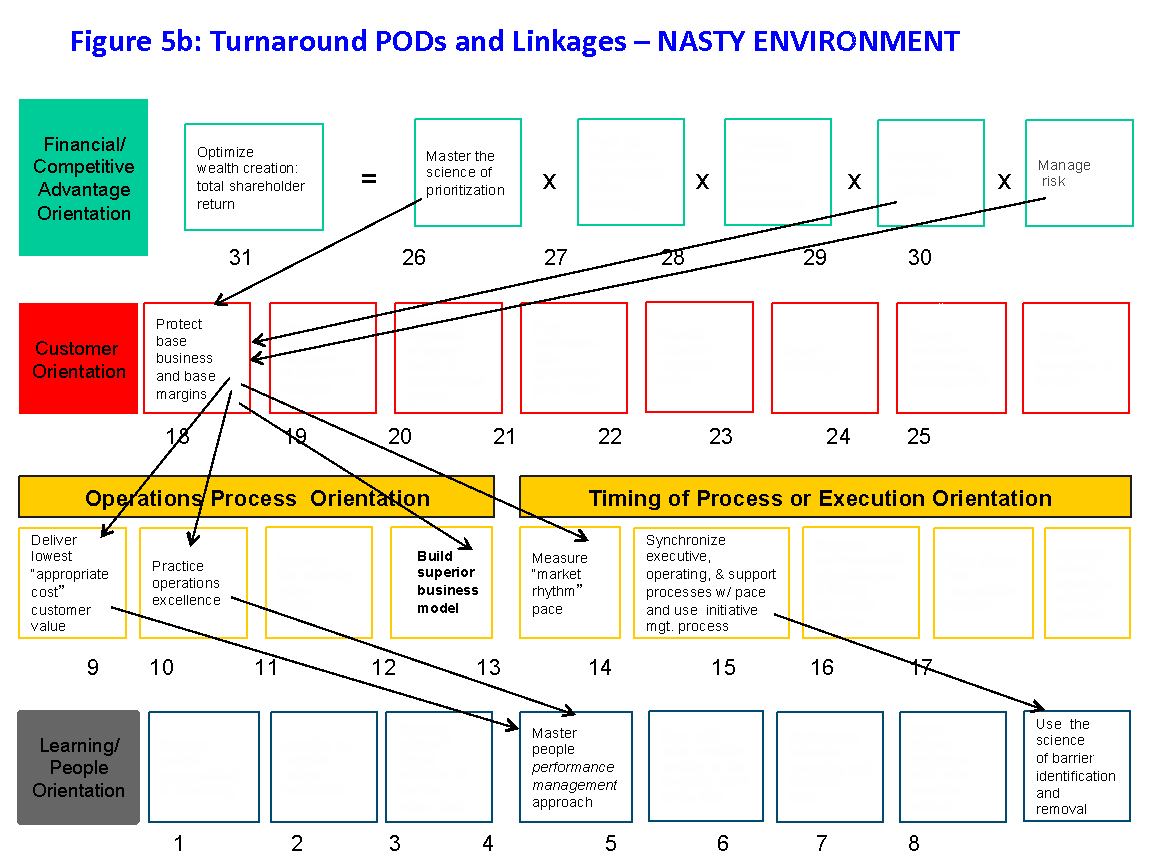
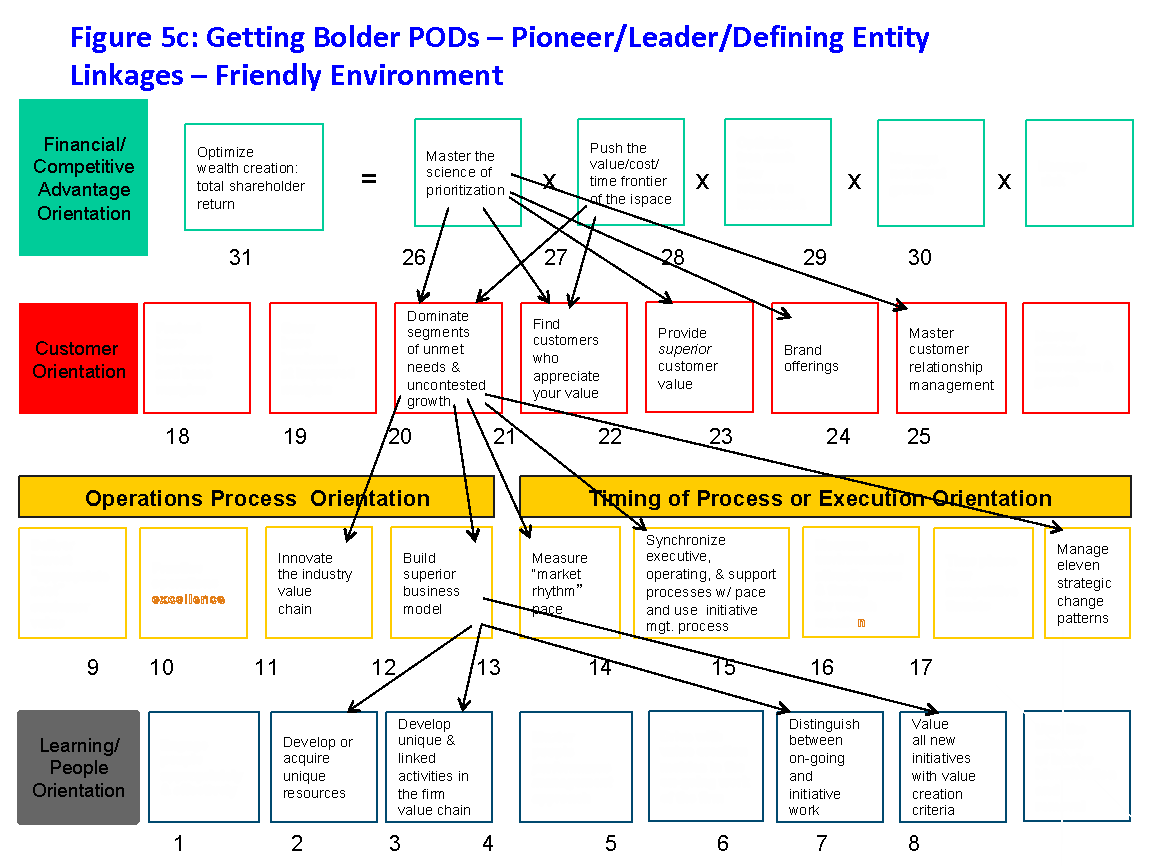
The complexity increases in that the importance of the set of high priority PODs (with their associated decisions) changes as the external environment of the firm changes. I call the nature of a firm’s external environment its “Environmental Carrying Capacity” (ECC). This framework is Dr. Porter’s Five Forces “on steroids” and depicts fifteen Dimensions. “Friendly” external environments allow a group of competitors to coexist and grow together. “Nasty” external environments are the opposite where Darwinian survival of the fittest tactics ensue. “Lukewarm” external environments are somewhere in between. Figures 5b and 5c shows the linkage pattern for a Nasty Environment and a very Friendly Environment.
Let me repeat: all of the thirty PODs are important. But given the breakneck pace of today’s world, we must prioritize to the vital few PODs that will win the day and drive increases in SHV.
What I found via statistical analysis over several years is that the ECC changes about every eighteen months. And with this external change, the emphasis of groups of PODs should change as well for increases in SHV. This drumbeat of eighteen months can be challenging for management teams as the emphases of groups of the PODs can change every eighteen months. But the few firms that take on these disciplines have won in SHV growth over rivals 80% of the time for those firms I worked with or those I have researched.
Timing the changes in POD emphases to the changing ECC helps maximize revenue relative to rivals in any kind of ECC – Nasty, Friendly or Lukewarm. Expenses can be managed better as well. Radical expense control is crucial in Nasty environments. In Friendly environments, expenses are optimized in growing situations – in other words discipline demands they do not rise inordinately. Working and fixed capital investment can be made with more surgical precision, thus negating a tendency in growth environments to “throw money” at opportunities. Finally, if managed to reduce the variability over time of FCFROI, risk can be reduced thus lowering the WACC. All of these decisions and moves increase SHV absolutely and relative to rivals.
Example 5: Causal Model of Shareholder Value via a Firm’s “Full Potential”
This last example of linking competitive strategy and SHV is my latest work in this area.
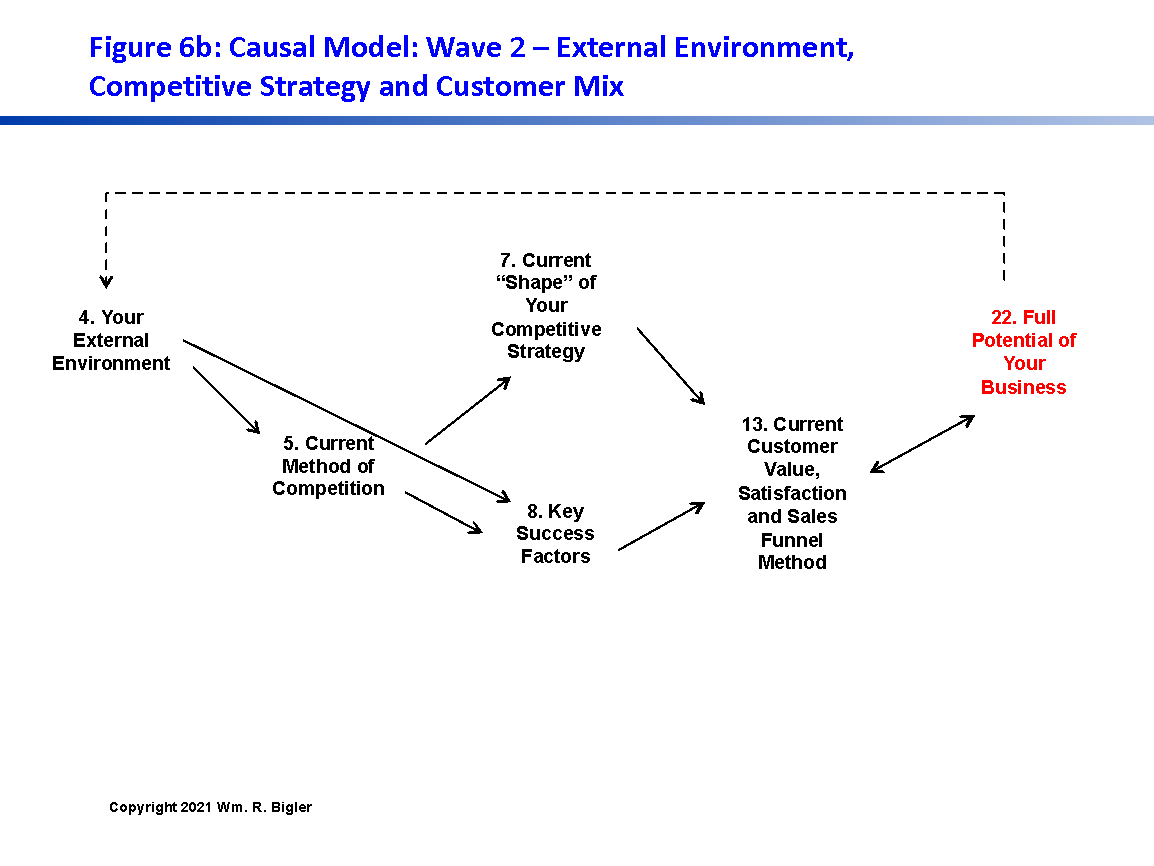
The Causal Model of Firm valuation is comprehensive. The full model includes five Waves and I only depict Waves 1 and 2 here as examples. See (Causal Model of Firm Valuation) for the full model. The model has twenty-two Elements over the five Waves. It derives from some practical academic research, some done by me in my intermittent stints as an academic in the field of competitive strategy. And I have also drawn from other academic research and from the publications of some of the leading strategy-consulting firms. But it mostly derives from my 26 years in the field of witnessing what works to grow a for-profit firm’s valuation.
The key feature of each of the five Waves is its interaction with a firm’s Full Potential shown in Red. This concept is borrowed from private equity (PE) and is a concept that provides a picture of what could be added to a firm’s core offerings and infrastructure at any point in time. This notion is very dynamic. As a current Full Potential is reached, a new Full Potential presents itself.
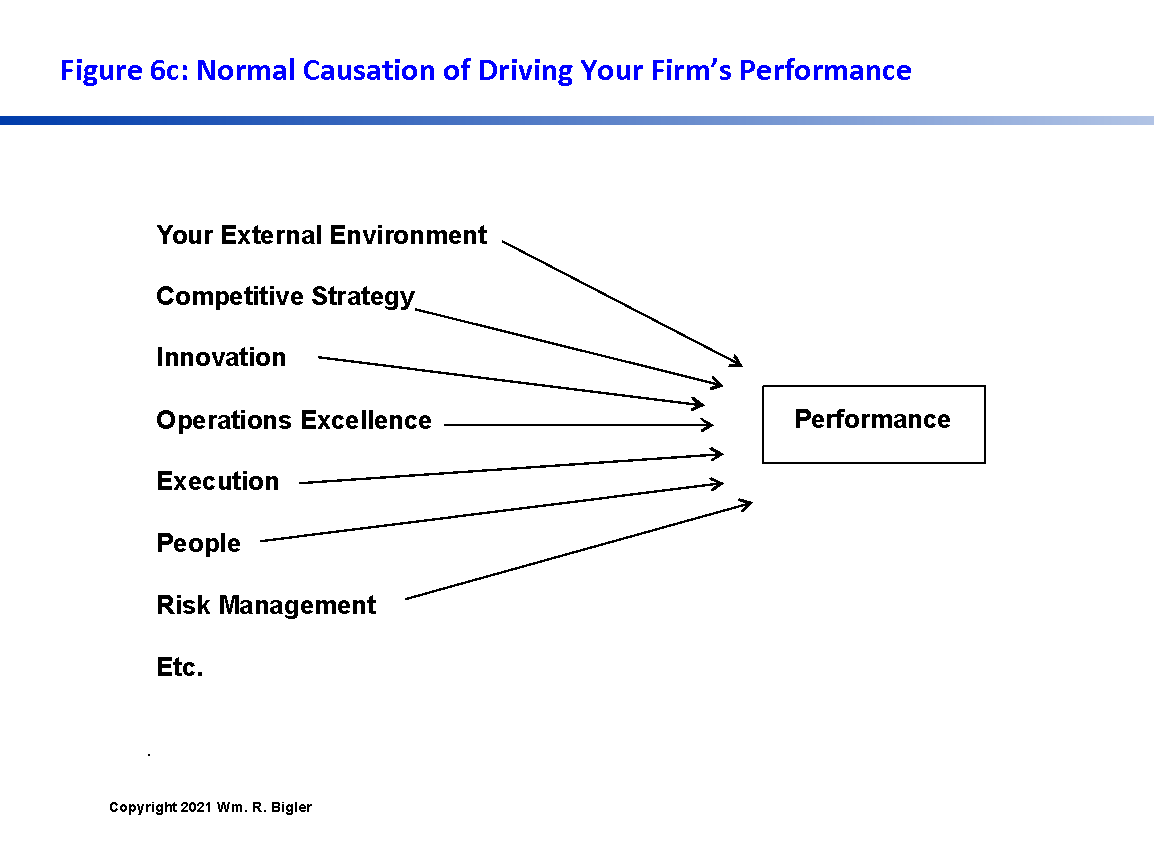
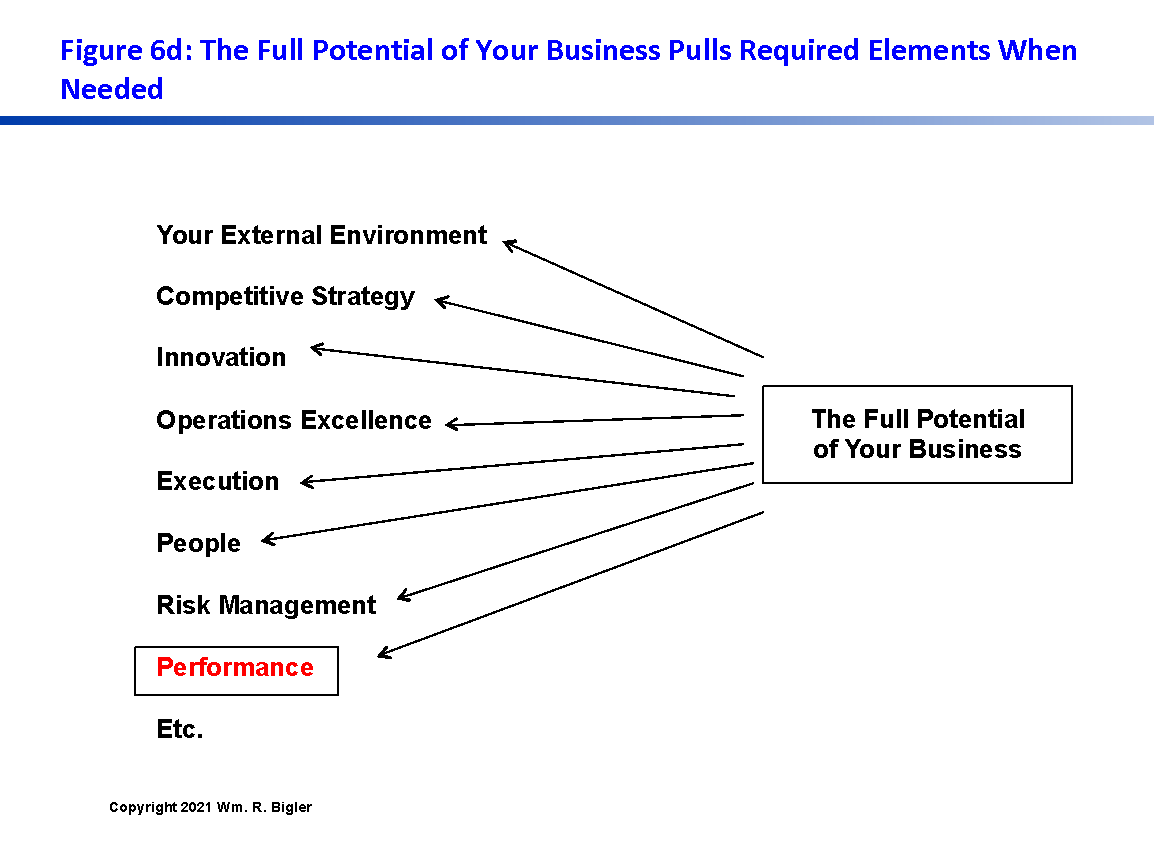
The concept of Full Potential can be rather abstract. Figures 6c and 6d try to clarify possible abstraction.
The mechanism that links the Waves to SHV is the configuration and management of the Elements within each of the Waves “pulled” by its Full Potential at the right time. Alignment with the ECC, as discussed above, is still important. But this time the “touchstone” is a firm’s evolving Full Potential. If the firm is wisely and prudently moving to its Full Potential, the same mechanisms that link the moves to increases in SHV are operative. So in one sense a firm’s Full Potential replaces the ECC from above as the firm’s touchstone or guiding star. For some management teams I have found this resonates better and more practically than alignment with its ECC. Thus the alignment of competitive strategy and firm valuation are found everywhere in the model. There is no escaping it.
How These Linkages Can Strengthen Practice
My hypothesis in Parts 1 and 2 of this article is that the knowledge between competitive strategy professionals and finance professionals (and academics in each field) can and should be improved. In the past and to a large degree presently, if a firm did model the expected increases in SHV from a change in CS or any other financial outcome, it would create five-year projections of cash flow and discount those to the current time period. While still useful, this approach allowed the strategists to sort of “throw the strategy work over the fence” to the finance professionals and ask them to make the forecasts. Sometimes when finance would in turn deliver their analyses back to the strategy group, they would make observations that were esoteric and thus not easily grasped as value-added additions by the strategy group.
By linking CS to SHV more closely, competitive strategy (CS) and the expected financial results never leave each other. They are two sides of the same coin that are “joined at the hip”. Over time a management team can learn to discern the expected financial effects from a CS in real time and in a way that everyone understands them. Thus the team can perform many scenarios much more quickly and make the decisions that are best expected to yield desired financial results.
And this linkage and ongoing learning help to lessen the issues when a corporate center of a multi-business unit firms needs to get involved. Recall all five of these examples occur at the business unit level of analyses, but the corporate center gets involved at least for resource allocation to and across the business units. A strong linkage of CS and SHV disciplines at the business unit level can help each business unit make its case for proper re-investment in each business. Or all can readily know when dis-investment or a sale of a business unit is warranted and will understand the rationale for such moves.
Ideas for Future Research
Let me summarize the five examples of the linkage of CS to SHV in Parts 1 and 2 of this article:
- The Value Stick – Customer Willingness to Pay and Supplier Willingness to Supply.
- The Value Chain linked to the elements of Free Cash Flow – Cash Flow From Operations less a Capital Charge.
- The 4Bs Chart and approach – an innovation and growth journey.
- The Business Performance Engine – a “canvas” of thirty Pockets of Decisions (PODs) whose emphasis changes every eighteen months as the external environment changes.
- The Causal Model of SHV – twenty-two Elements “pulled” by a Firm’s Evolving Full Potential.
The mechanism I posed by which these examples of a framework of CS impact the Drivers of Financial Valuation is their ability to lessen Fade and increase Competitive Advantage Period.
But is there more to it than this? For instance, could the real mechanism to drive results come through an increase in People Productivity? Indeed Dr. Oberholzer-Gee depicts several examples of people productivity mechanisms aiding in firm performance by lowering Supplier’s Willingness to Supply. This hypothesis puts People, as one of a firm’s suppliers, in a key position.
Figure 7 depicts this assertion. The Question though is what other intermediate causal mechanisms are there that we should be considering? This is the real critical question that this article poses for further discussion and research.
References
- Bigler, William R., “A New Vista for Strategic Management: Continuously Aligning the Inside with the Outside”, Management Accountant’s Quarterly, Spring 2019.
- David Holland and Bryant Matthews, Beyond Earnings: Applying the Holt CFROI and Economic Profit Framework, Wiley, 2018, 383 pages.
- Bartley J. Madden, Value Creation Principles, Wiley, 2020, 250 pages.
- Bartley J. Madden, Maximizing Shareholder Value and The Greater Good, LearningWhatWorks, 2005, 54 pages.
- Greg V. Milano, Curing Corporate Short-Termism: Future Growth vs. Current Earnings, Fortuna Advisors, 2020, 351 pages.
- Cynthia A. Montgomery, The Strategist: Be the Leader Your Business Needs, Harper Business, 2012, 189 pages.
- Felix Oberholzer-Gee, Better, Simpler Strategy: A Value-Based Guide to Exceptional Performance, Harvard Business Review Press, 2021, 288 pages.
- Alfred Rappaport, Creating Shareholder Value: The New Standard for Business Performance, Free Press, 1986, 270 pages. Revised edition 1998, Free Press, 205 pages.
- Michael Porter, Competitive Advantage: Creating and Sustaining Superior Performance, Free Press, 1985, 557 pages.
- Bennett Stewart, The Quest for Value, Harper Business, 1991, 800 pages
This article is part of a series on what causes a firm’s value to increase.
Dr. William Bigler is the founder and CEO of Bill Bigler Associates, an independent competitive strategy with shareholder value research boutique. He is a former Associate Professor of Strategy and the former MBA Program Director at Louisiana State University at Shreveport. He was the President of the Board of the Association for Strategic Planning in 2012 and served on the Board of Advisors for Nitro Security Inc. from 2003-2005. He is the author of the 2004 book “The New Science of Strategy Execution: How Established Firms Become Fast, Sleek Wealth Creators”. He has worked in the strategy departments of PricewaterhouseCoopers, the Hay Group, Ernst & Young and the Thomas Group among several others. He can be reached at bill@billbigler.com or www.billbigler.com.

